If you would like to see how your Panopto content is being watched by your viewers, there is a wealth of information that can be provided to you from the Panopto stats pages. This is useful for being able to see how engaged your viewers are with your content and highlight any learning and understanding trends. The stats available for the whole recording folder, individual sessions down to individual viewers on your courses.
Folder Stats
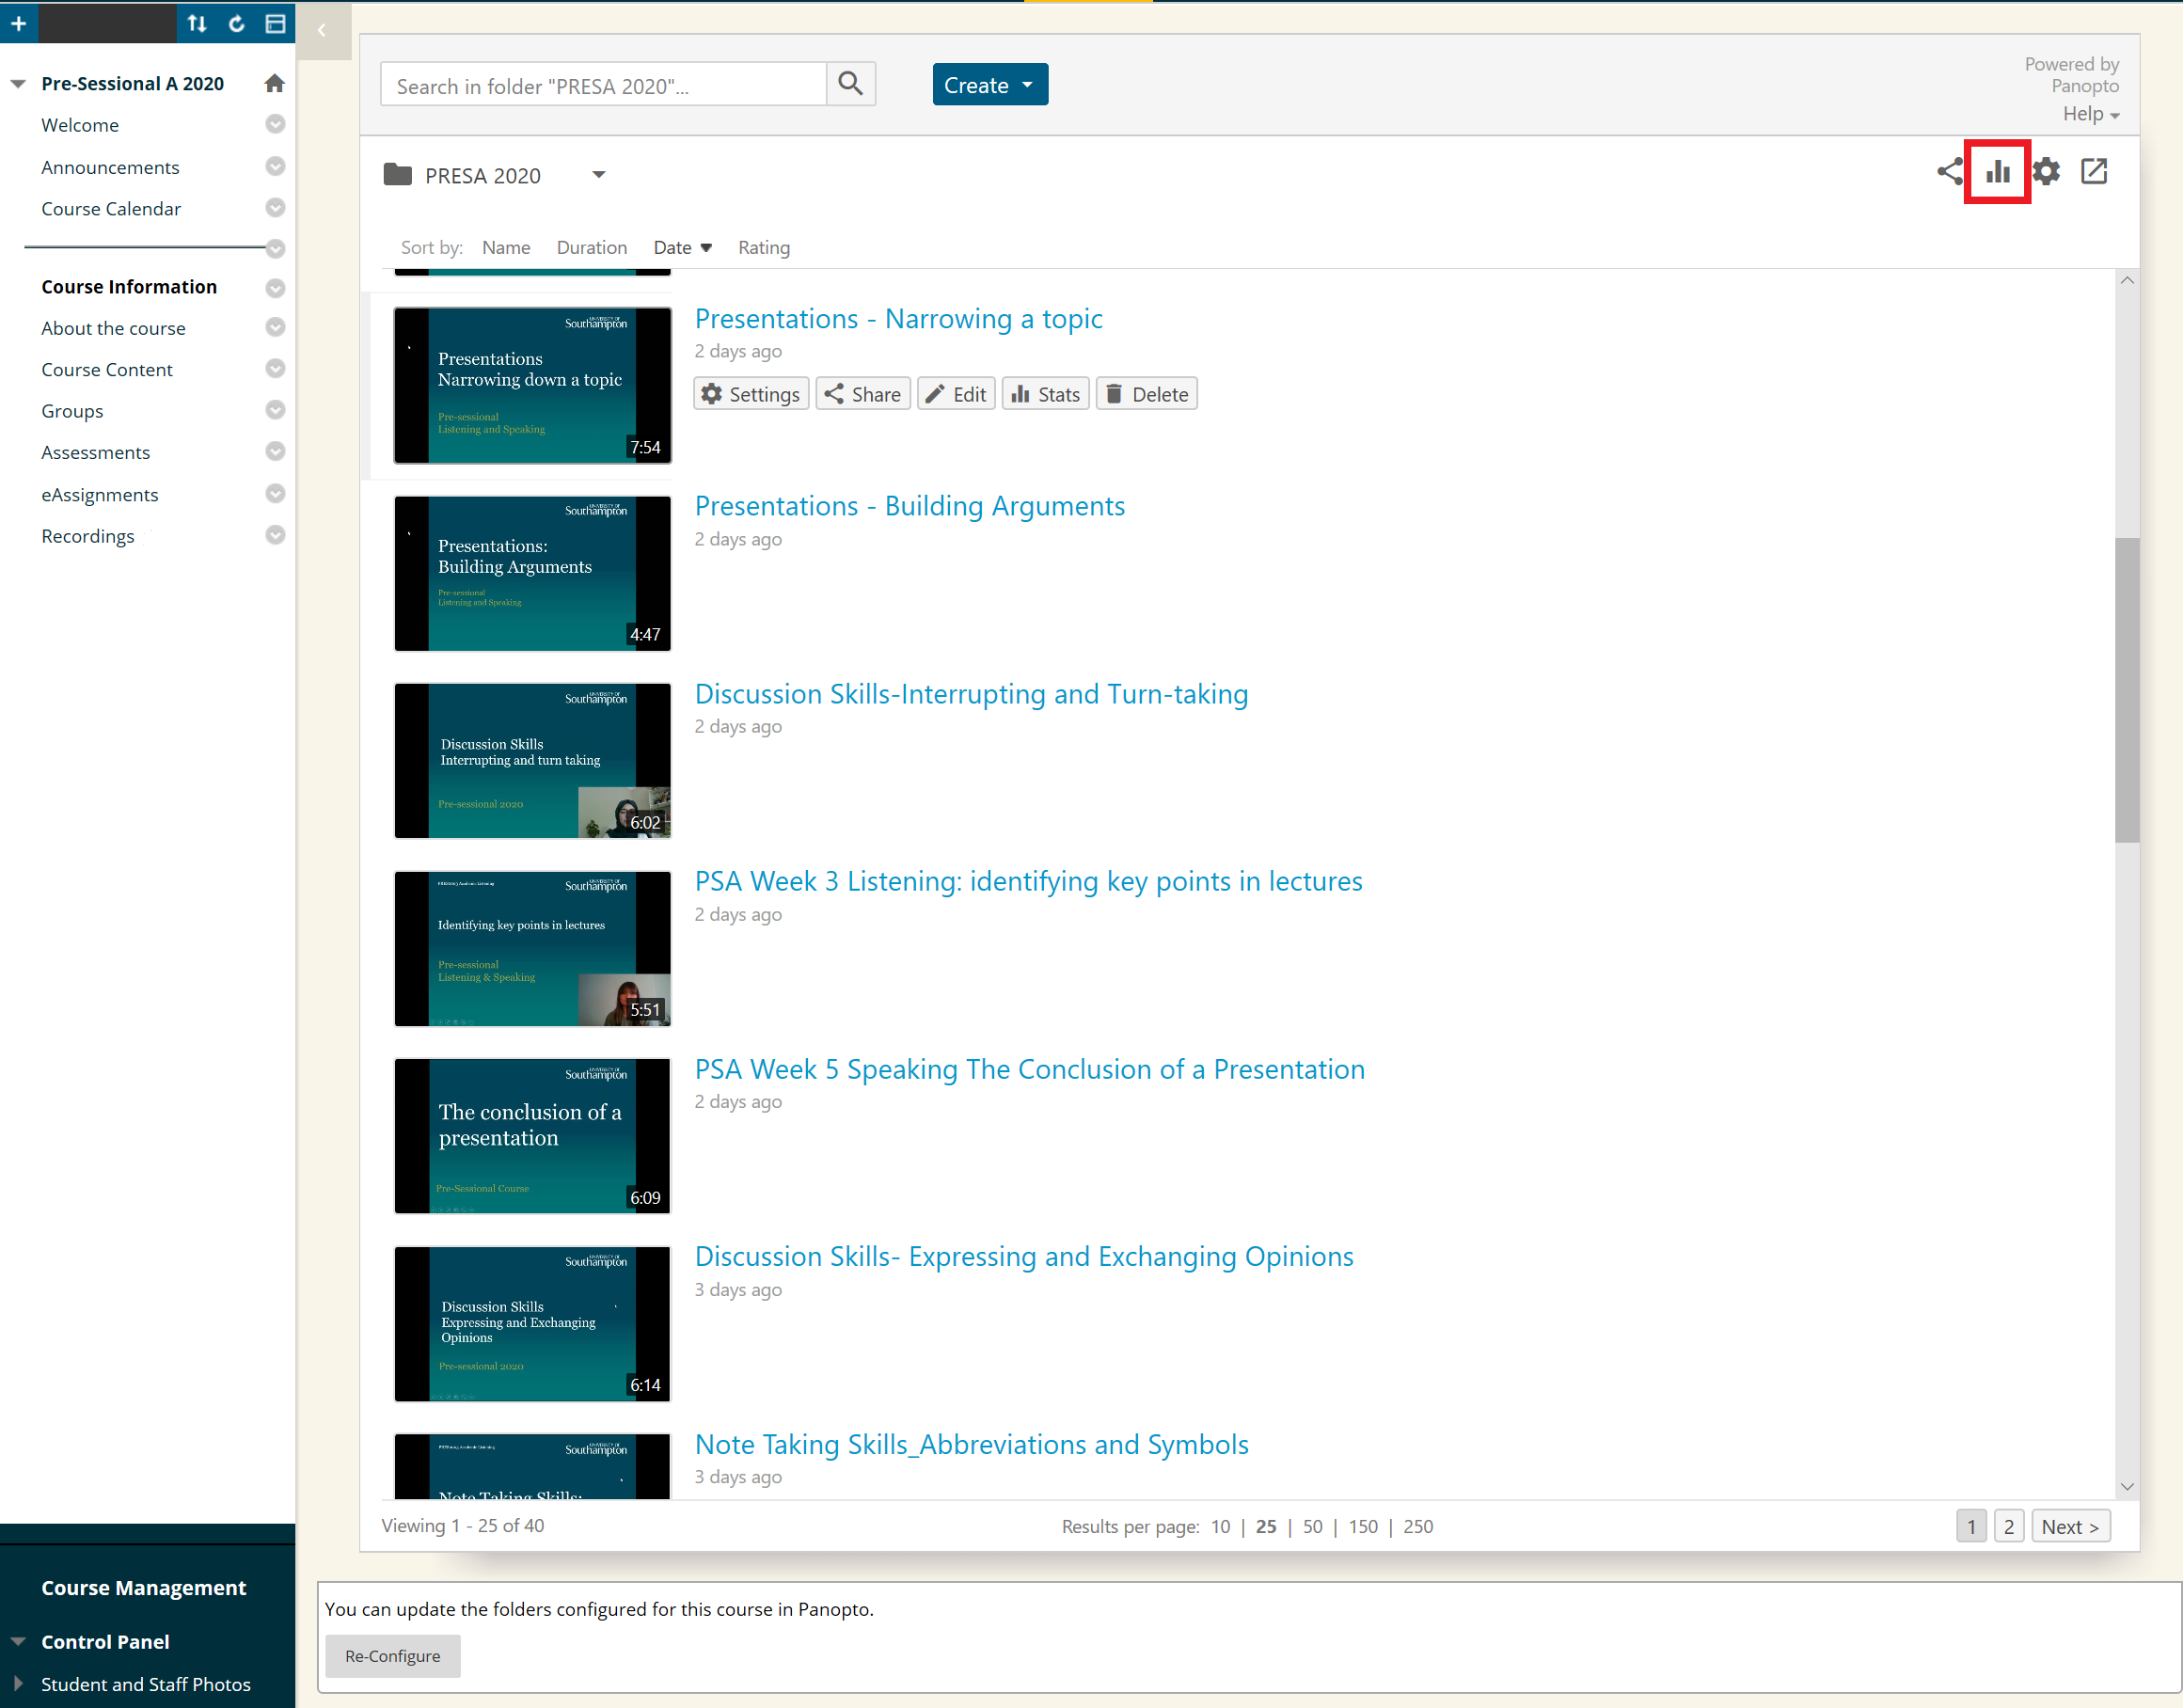
To view the stats for your course Panopto folder go to your Blackboard course and in the top right click on the bar chart icon for ‘Folder Stats’.
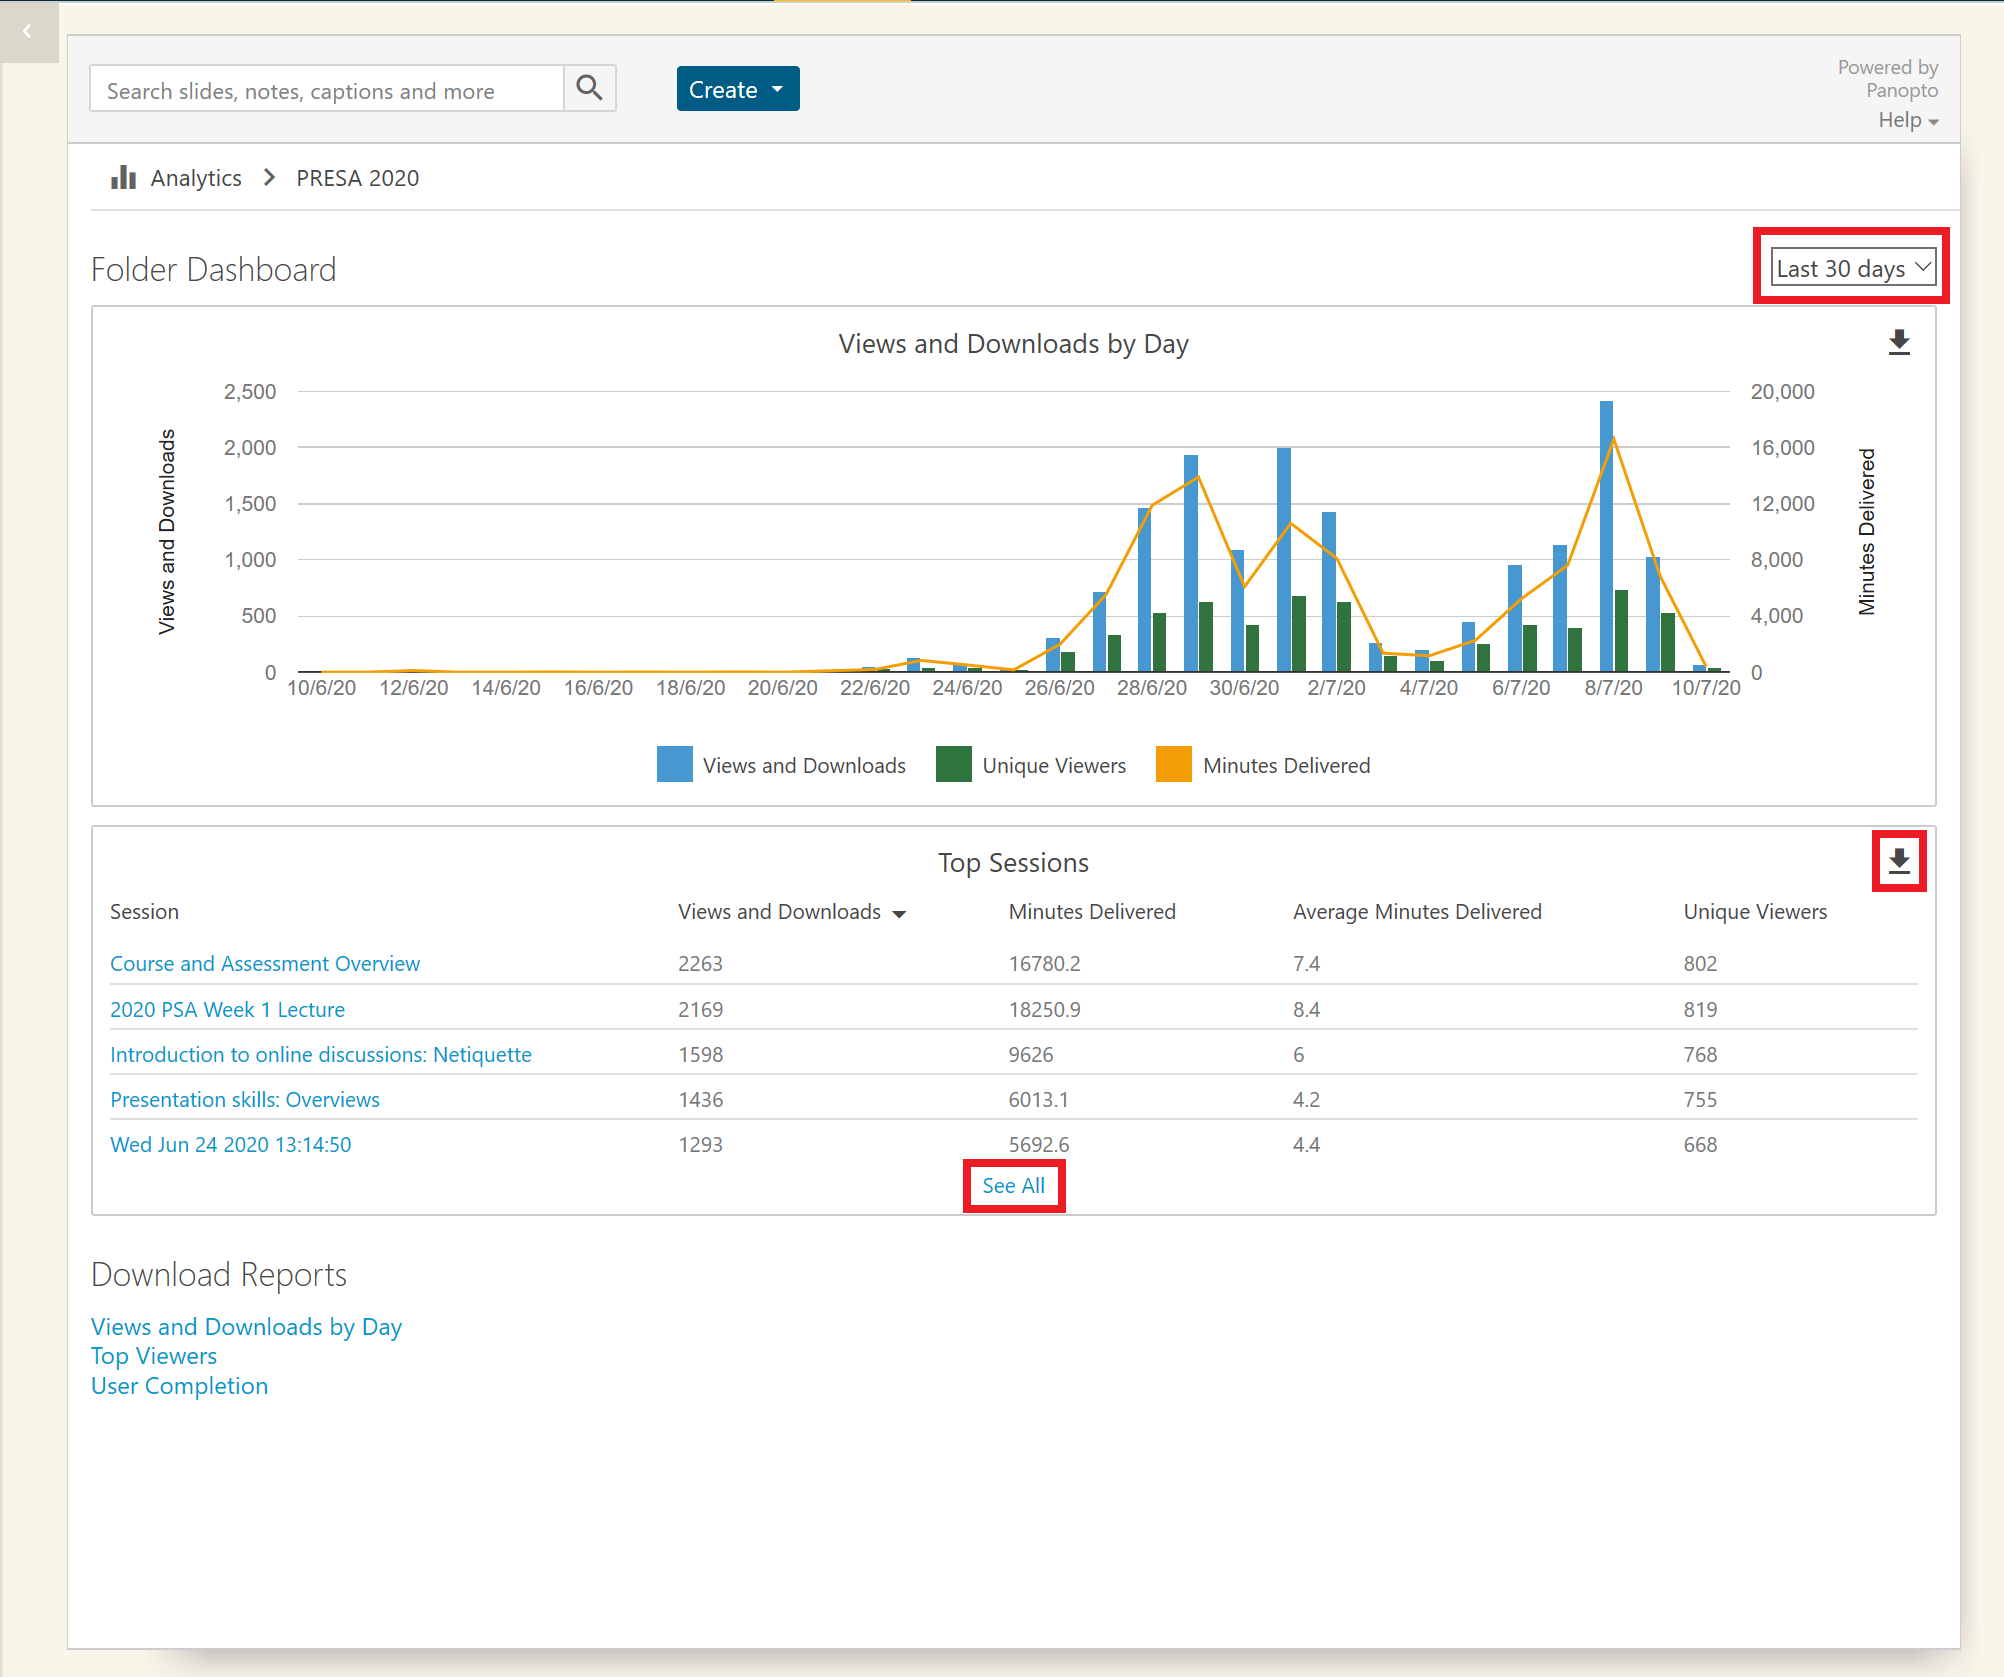
The stats page will show you how much content has been viewed and list the most popular sessions in the folder. It also shows how many different viewers have watch a session, this can give an indication of how many people out of a course have seen the content.
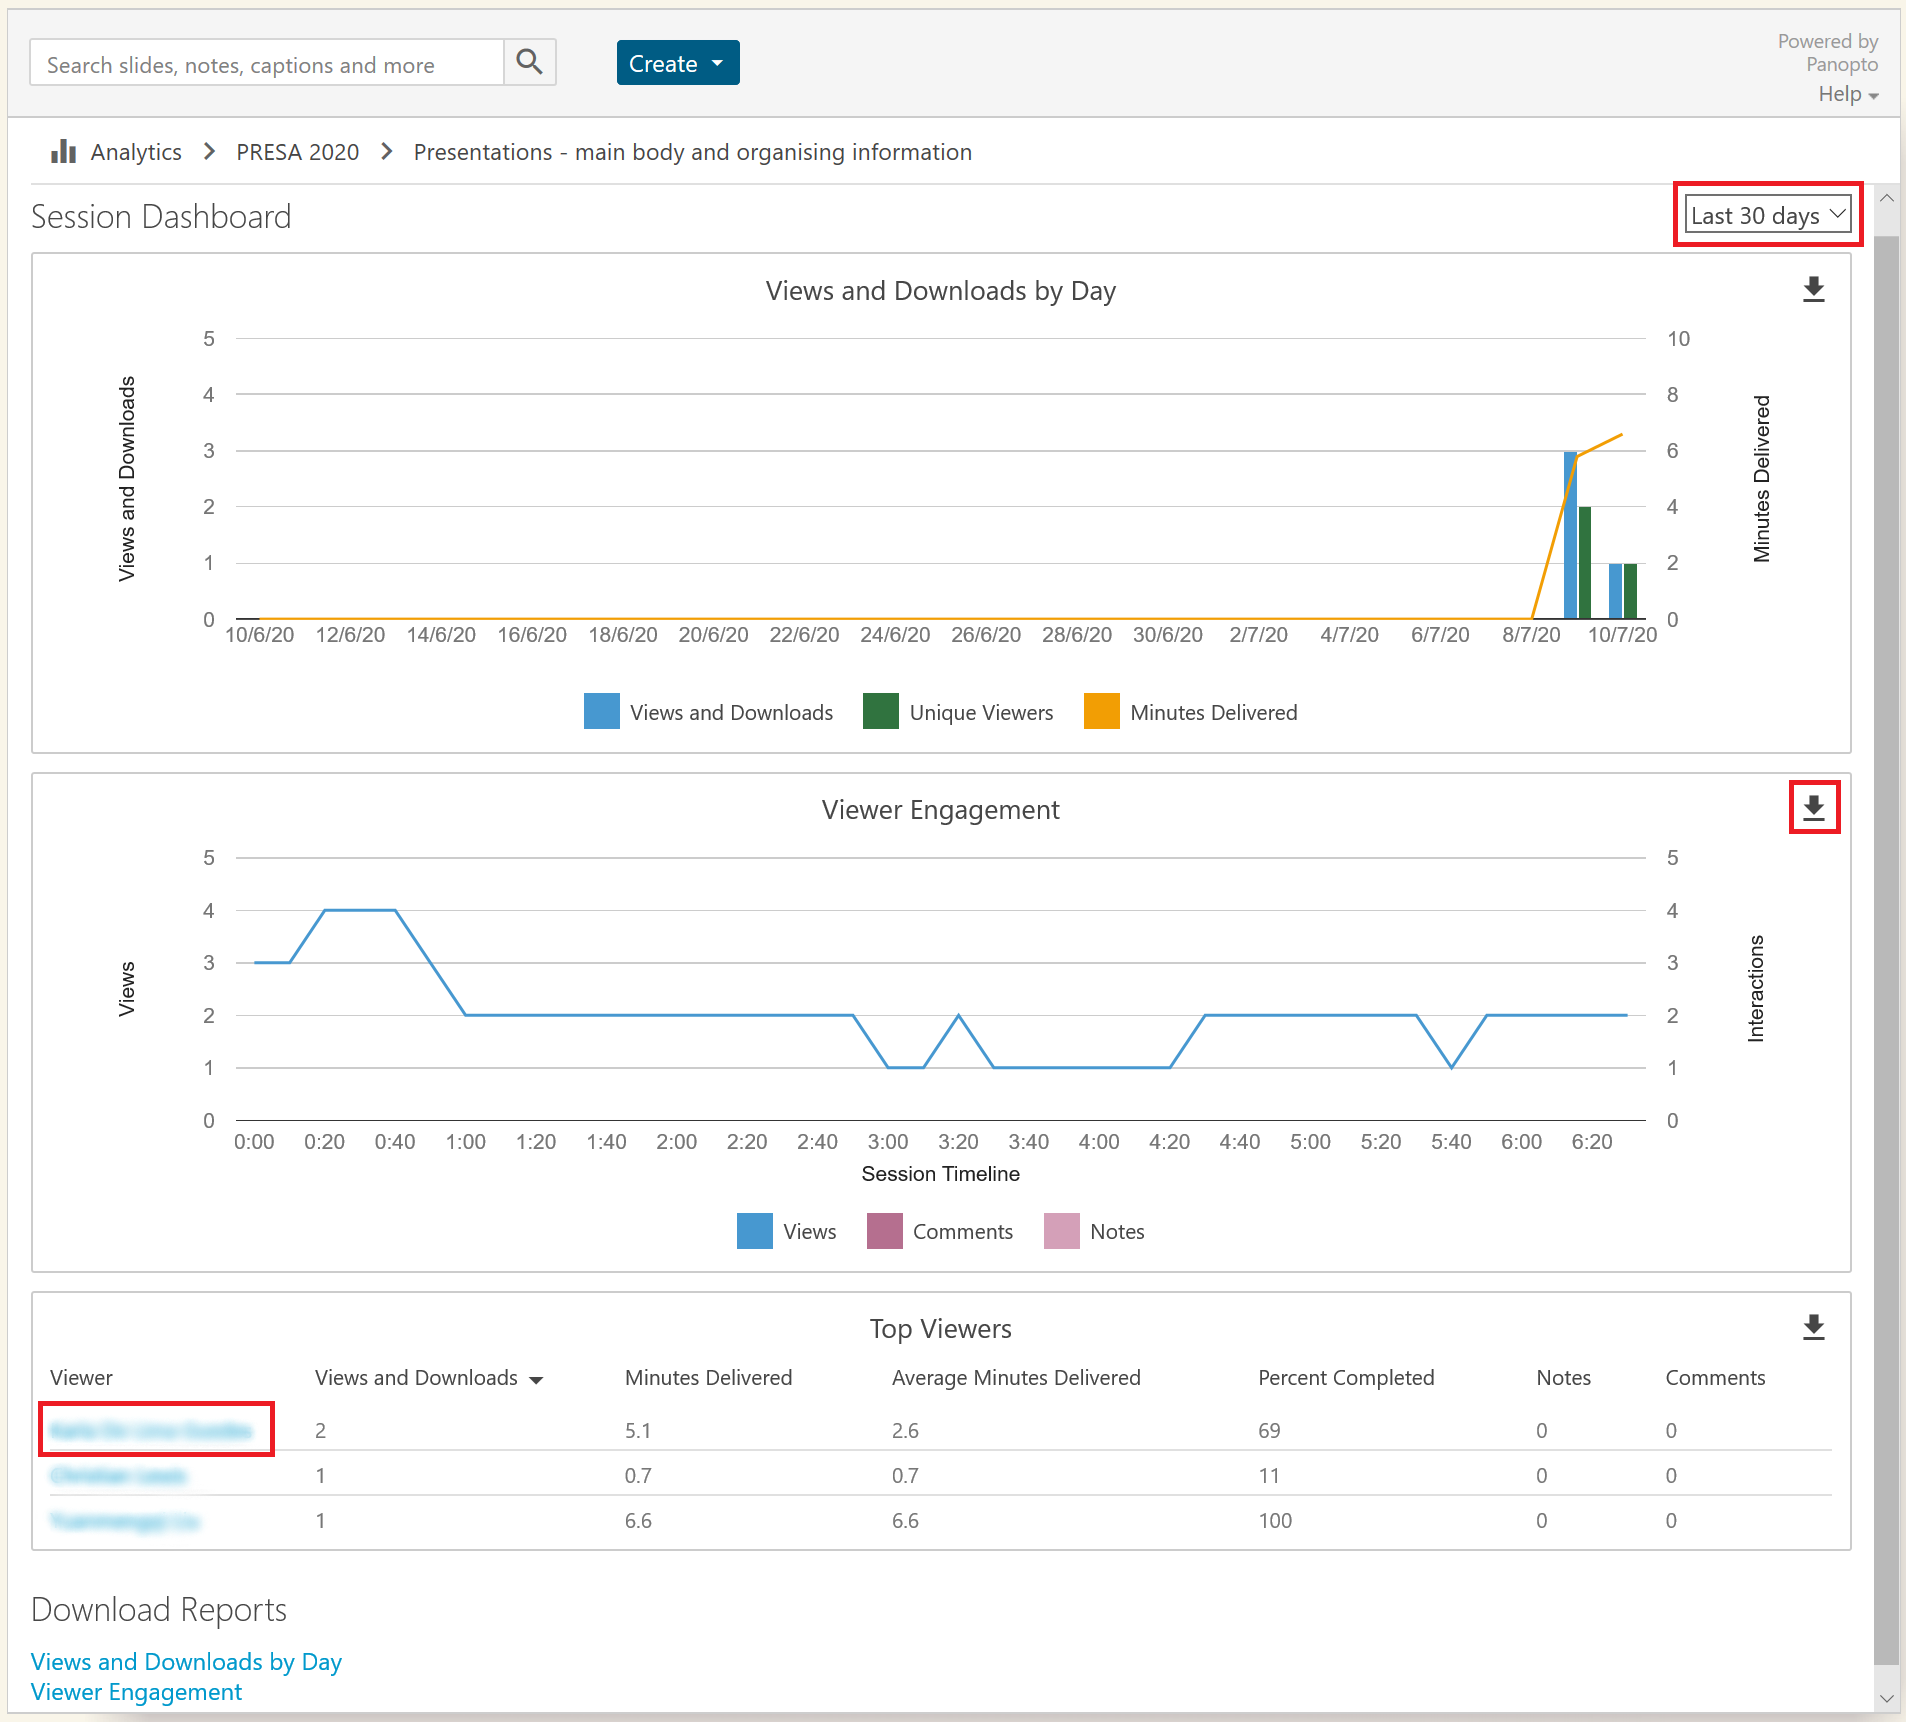
By default it will show the last 30 days of data, in the top right click on the drop down menu to select a different date range.
Notice on the charts there is a download icon, click on that to instantly get a .CSV file of the raw data that created the chart.
To see more than top 5 sessions click on the ‘See All’ word button and to download additional reports click on the word buttons under the ‘Download Reports’ section.
Individual Session Stats
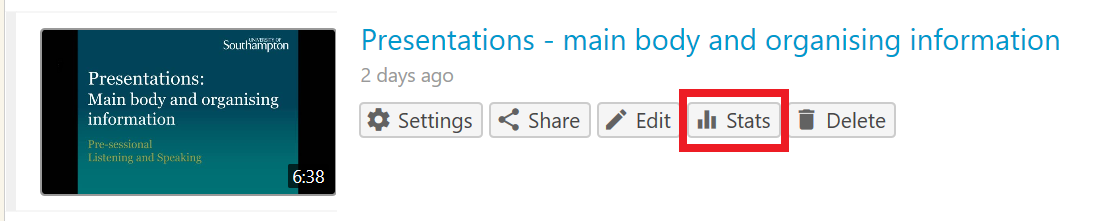
To view more detailed stats on an individual recording go to the recording you wish to know more on and move your mouse over it. You will now see more menu options to the session, click on the ‘Stats’ button.
It will now show the stats page with high detail. It has the same options of being able to change the displayed date range and to be able to download the raw data.
There is a very useful chart on ‘Viewer Engagement’, this shows a timeline for the session and how many times a certain point of a session is watched. This could mean that your viewers find a part of the session very interesting, it could also show an area of content that they are finding difficult to understand and need to review further. It also shows if viewers have made more notes or comments about key points in the session timeline more than others.
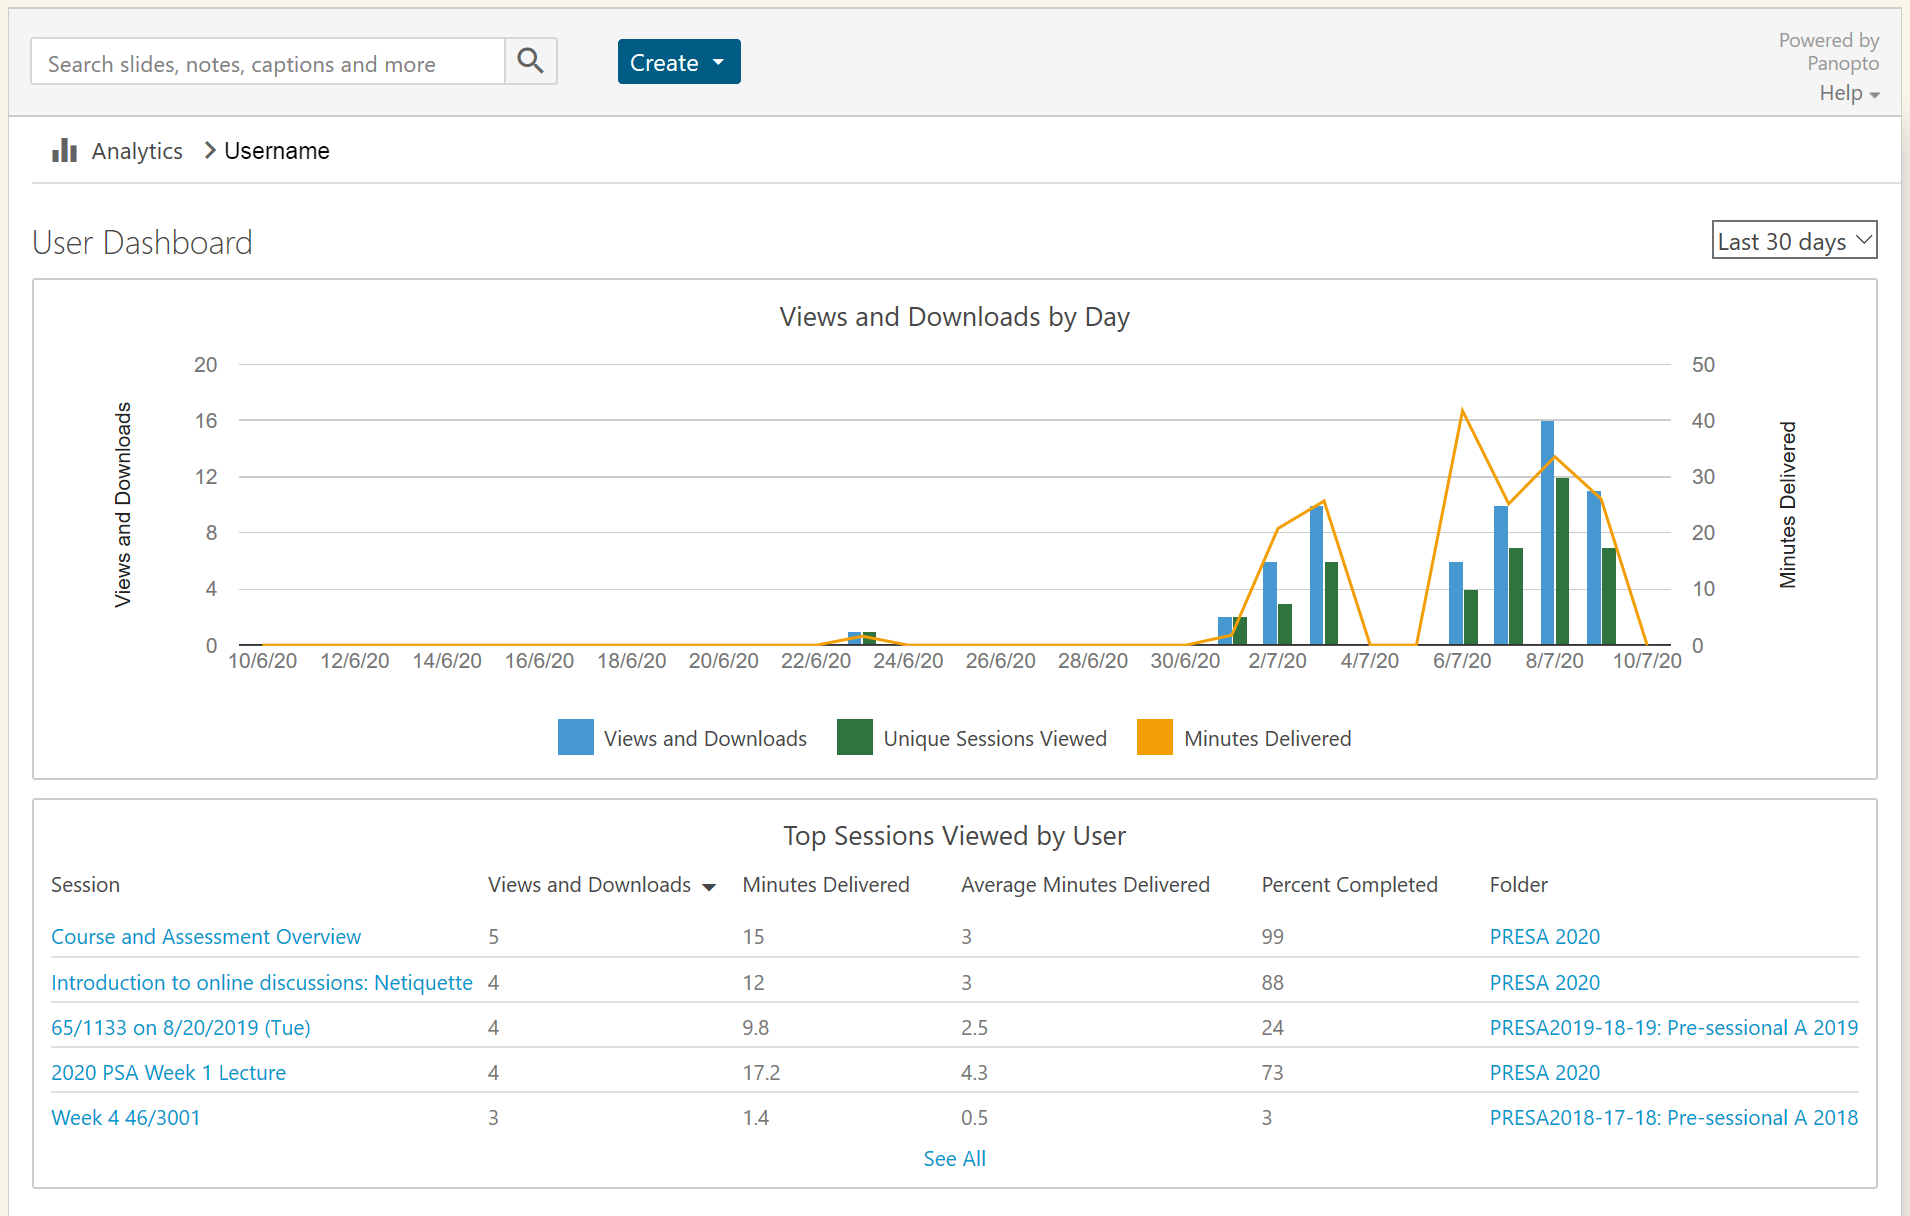
It also has the names and data of individual viewers showing their individual engagement to the session. It is also possible to click on their name to get further detailed information.
For an individual user it will show you their interaction with all content that you are a instructor on and gives the same abilities as the other stats pages.