
The Column Statistics page displays statistics for a grade item, including average, median, and standard deviation. You can also view how many need grading and how the grades are distributed.
- From your course Control Panel open the Grade Centre.
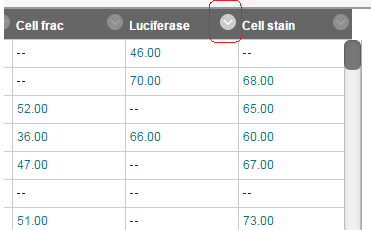
2. Find the column about which you are interested in producing statistics and click on the action button beside the column heading.
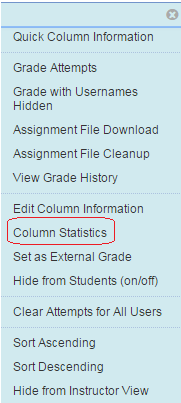
3. Choose Column Statistics from the menu that appears.
4. The statistics will be shown.

Available Statistics
- Minimum and Maximum Values: The lowest and highest values of all graded columns in the Grade Centre
- Range: The numeric range between the lowest and highest grades for an item
- Average: The statistical average of the item
- Median: The midpoint score of the items
- Standard Deviation: The difference between the values of the item and the average of the item
- Variance: A statistical measure of the spread or variation of the items