8.3 Web-based GIS: professionals sharing data
The development of technologies such as Google Maps, Microsoft Virtual Earth, and Google Earth has influenced recent functionality within GIS software. Some GIS packages now provide the capability for GIS professionals to make use of spatial data delivered through the web, so web-based functionality that was initially provided for members of the public is influencing the functionality available to GIS users. There are broadly two ways that GIS professionals can work with spatial data from online repositories:
- Firstly, it is possible to search for appropriate data (both raster imagery and vector data) in an online repository and stream this imagery and vector data for use within a desktop GIS, in much the same way as an application like Google Maps or Google Earth would do. Typically, the streamed data can be used as a backdrop for other map layers that are held locally and very often, the ability to manipulate any streamed data is restricted in some way, e.g. it may be possible to display a set of vector lines, but not to calculate distance buffers around them (see Figure 1 and/or the resource centre reference below for examples of data that are held in this way).
- Secondly, in a more Web 2.0 style of use, in which communities of users generate and share content, it is also possible to upload data packages onto an online repository to be shared with others. Uploaded data packages can be shared with pre-defined groups of users, or more widely with the general public. The usage of the data and its display format can also be controlled during upload (see the blog post below).
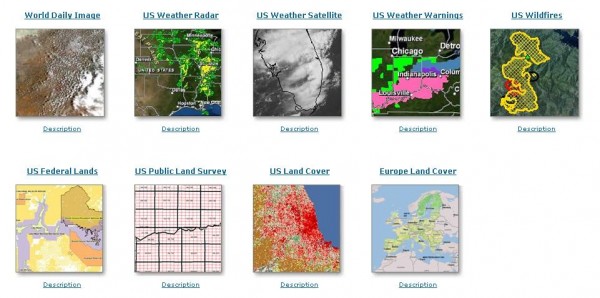
Figure 1: Some examples of public domain environmental data, available as layers streamed to a desktop GIS from an online ESRI resource centre.
There are of course technical challenges in ‘streaming’ such data from a web server to a desktop GIS and the display of imagery held online is typically much slower than the display of data held locally. For example, effective use of online imagery and vector data involves caching the data locally (i.e. temporarily storing recently used data locally on a desktop), supplying imagery that is already at the required resolution to be displayed on screen, and finding appropriate ways of tiling data (i.e. developing a system of non-overlapping ’tiles’ or map sheets to cover a data set at a given resolution) to cover the study area being displayed.
Various technologies, standards and protocols are available for handling map data within online repositories. For example, the Open GIS Consortium has defined several standards for supplying data over the web:
- the Web Mapping Service (WMS) standard is a means of requesting and receiving maps in the form of imagery. In effect, the maps are delivered in much the same way as a non-spatial image or picture would be via this standard.
- A Web Coverage Service (WCS) provides a means of requesting and receiving raster data. Via this standard, the imagery received is richer than WMS in that the individual pixel values are delivered and not solely imagery.
- A Web Feature Service (WFS) delivers vector data over the web.
Alongside these standards, other, proprietary web mapping protocols are also available.
Given developments in other areas of web-based technology, it seems likely that the use of such online repositories of environmental data will increase in the future.
Activity
Download this GIS exercise that describes the use of web-based environmental data.
References (Essential reading for this learning object indicated by *)
If you are not using the latest version of ArcGIS, you can see examples of the kind of environmental data that are available online via the ArcGIS Hub: https://hub.arcgis.com/items?tags=Coral%20Reef (this link shows geospatial data relating to coral reefs).