Unit 1: Introducing GIS in Environmental Management
If we genuinely wish to apply GIS to environmental management, then we should start by agreeing what environmental management is. This is easier said than done, since there is no universally-agreed definition, but we can create a working definition that will enable us to appreciate the way in which this course module is organised. Five statements combine to offer us such a foundation, though it is acknowledged that each would be open to debate were it not for the fact that our present imperative is to move towards GIS rather than dwelling on the underlying philosophy:

Figure 1: A water vole, a study of them in UK rivers used GIS as a crucial tool.
- Environmental management is not the same as physical geography, environmental science or environmental social science, though it embodies elements of each. Disciplines such as geography and environmental science (often using GIS as a tool) provide useful information or insight to managers, but they are not in themselves “management” even if they are studying physical processes that impinge on people.
- Environmental management is fundamentally about “doing” – specifically, it is concerned with intervention in the relationship between different stakeholders and environmental resources or processes, and works either by modifying the environment or by adjusting the people or their expectations. This is where we want to put GIS to work.
- Decisions precede actions, so most people would regard environmental decision making as being an integral part of environmental management (though purists would argue that decisions that are not followed by actions do not actually create management).
- GIS can also be used to help us to understand the processes and procedures of environmental management (which are wholly different to understanding the processes of physical geography or environmental science). This is not the same as actually managing the environment, but is sufficiently closely related for it to be a part of the agenda of this course module.
- Strictly speaking, anyone who makes a decision or undertakes an action that represents an intervention in the relationship between people and environmental resources or processes could be called an “environmental manager”. For the purposes of this course module, however, it is convenient to adopt a narrower definition within which environmental managers are those who play some formal, professional or institutional role in the procedures of environmental decision and action, while other people (including “the public”) are viewed as stakeholders but not managers.
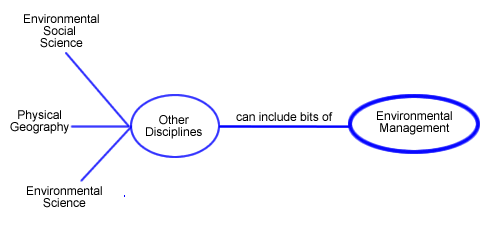
Figure 2: An example of a Spray Diagram
If GIS is to play a role in environmental management, then GIS functions must be applied to data in such a way that environmental managers are able to reach better decisions or undertake better actions – where “better” is defined broadly in terms of attributes such as effectiveness, cost-efficiency, social and political acceptability, equity and sustainability. This application of GIS principles to environmental management practice involves a hierarchy of technical processes:
- Data acquisition and management: survey, data conversion, data quality control, metadata, data structure.
- Data integration (multiple layer approaches) and visualisation (“mapping”) – including the combination of variables into representational and diagnostic indices.
- Multi criteria approaches (synthesising and relating data sets).
- Spatial and temporal interpolation and extrapolation.
- Analysis (including area norms and residuals, trends and rates of change).
- Spatial and temporal modeling. An example of spatial modeling is predicting what soil chemistry will be like from analysing data on plant cover. Temporal modeling would be looking at the erosion on a steep hillside which has been caused by overgrazing of the plant cover and predicting how it will develop in the future given various different grazing use scenarios.
- Decision support (including the handling of fuzzy and uncertain elements)
The order in which functions are placed in this list could be debated, since the intention is to represent a spectrum from the simple to the complex and from the real world to the management representation. However, even if the detail is discussed the overall pattern is robust and suggests a powerful range of roles for GIS in environmental management. To a significant extent, these roles could be seen as applying standard GIS functions to environmental management data, in which case this course module would be little more than a reinforcement of existing skills. In practice, environmental management GIS has its own particular flavour based largely on the nature of the data and the nature of the management processes within which GIS is applied.
It is also important to appreciate the extent to which environmental management GIS applications are, in practice, embedded in social and political processes. Environmental management is not an objective process (see object ‘From data to indicator’) and it follows that GIS application in environmental management is inevitably (and often quite properly) subjective, no-matter how crisp and objective the actual GIS functions might appear to be.
Given this background, it is clear that there are many possible approaches to GIS in environmental management. For this particular course module, the chosen order is based loosely on the hierarchy of functions listed above and on the proposed definition of environmental management:
Part 1: Introduction
Unit 1: The module opens with an examination of information-based environmental management: exploring the links between data and management, specifically through the example of developing environmental indicators and a case study of the New Forest.
Unit 2: Environmental data acquisition and delivery build on the underlying concepts of data and data management, emphasising the extent to which the application of GIS can be constrained (or empowered) by the available technologies. The examples used are GPS data acquisition and web-based GIS delivery.
Part 2: Dimensions of Environmental GIS
The dimensions of environmental management GIS serve as a basis for building a hierarchical list of applications, starting with two dimensions and working through three and four (time-based GIS).
Unit 3: Adding the third dimension takes us to digital elevation models, and to the technical challenges of visualisation and of model quality. DEMs underlie many GIS applications, but their veracity can be over-emphasised and there is value in critiquing their construction.
Unit 4: By exploring a series of applications of three-dimensional GIS using examples of radiation modeling, wind energy and forest management, the point is made that “management” as such relies on a fusion of technical routines and problem-solving structures.
Unit 5: The fourth dimension (time) brings us to dynamic modeling and the handling of spatio-temporal data to represent change through time. Given the increasing significance of environmental modeling within a framework of adaptive management, this approach is a key to forecasting, scenario building and management option choice.
Part 3: Environmental management applications
Are the culmination of the course module, bringing together a range of functions and skills within the integrating framework of environmental problem solving. Three application areas have been chosen to represent this holistic approach, starting with
Unit 6: environmental assessment, including impact assessment and strategic EA. This is a practical management context within which GIS has become a core tool.
Unit 7: Ecological management is another inherently-holistic field, and is often specified as a core component of environmental legislation and regulation which brings together the representation of animal and vegetation populations, their handling within suitability indices, their relationship with landscape and their temporal interactions and modeling– thereby effectively summarising the elements of the module so far.
Unit 8: This final unit looks at the idea of spatial decision support systems and how GIS can be used to support decisions in the environmental sector.
Although each unit stands on its own, there is a coherence in their inter-relationship and the module is thus able to reflect the scope and structure of GIS in environmental management without in any way claiming to be comprehensive.
Introducing Course Unit 1: From Data to Indicator
The remainder of this unit (Unit 1) covers the following topics:
1.1: Data – an insecure foundation for environmental management?
1.2: From data to indicator
1.3: Adaptive management
1.4: Information-based environmental decision-making – the role of GIS
The first of these objects looks critically at some of the inherent problems in gathering and relying upon data when making decisions. The next unit considers how raw data may be developed into indicators – measures that quantify the status of natural resources. The third unit considers how we can respond to information when making decisions about managing our environment. The final object, ‘information-based environmental decision-making’ looks specifically at the contribution of GIS to environmental management.
Activity
Spray diagrams are a very useful way of exploring an issue. As someone who is adept at using GIS you may find these diagrams useful as a way of organising your ideas (it tends to appeal to people who have a high spatial intelligence like yourself) which is why we have asked you to invest a little time in learning to use it in the rest of this activity. As an example I have produced a mini spray diagram in Figure 1 showing how point [1] in the list could be illustrated using this technique.
-
- View the spray diagramming link to find out how to construct spray diagrams. Look at both ‘What are spray diagrams’ and ‘Drawing Spray diagrams’.
- Choose a particular environmental management decision or scenario. If you work in environmental management, you may wish to choose a relevant workplace situation. Alternatively, you may wish to select a scenario that particularly interests you (e.g. the management of seismic surveys to minimise impacts on marine mammals, say).Produce a spray diagram with ‘Environmental Management’ as the starting point summarising the main stakeholders and academic disciplines that are involved in the example you have chosen.You can either generate your spray diagram by using pen and paper, using drawing tools within word, an XL sheet, power point (all on one slide), a GIS package or any other drawing package that can produce a .jpg, .png or .gif file type as an output. Bear in mind that producing such diagrams on computer can be time-consuming and pen and paper may well be the fast means of developing your spray diagram.
- When you have finished your spray diagram, post a short paragraph to the course discussion board, describing your scenario / decision and the stakeholders and disciplines involved in it. This may be quite a personal view based on your own professional background and experience. If you produced your spray diagram on computer, feel free to share your diagram with your colleagues by posting it to the course forum. However, you are not required to do this and you should not spend excessive amounts of time developing the spray diagram on computer.
Please do not spend more than 1 hour on this whole activity.
References (Essential reading for this learning object indicated by *)
*Spray diagramming: Follow link for spray diagramming from here: https://www.open.edu/openlearn/science-maths-technology/engineering-technology/spray-diagrams