6.1 Introduction to Time in Environmental GIS
This object introduces the concept of time in GIS. All GIS systems have the capacity to work in two dimensions – for example, when representing vector data as x- and y-co-ordinates. Nearly all GIS systems also have the capability to represent elevation as a third dimension. In less sophisticated systems, this capacity may simply be the ability to handle Digital Elevation Models. In more sophisticated / specialist GIS software, all features may be represented spatially using x-, y-, and z-co-ordinates with the z co-ordinates being the feature’s height or depth. Time is often described as the fourth dimension in GIS. Many authors consider that handling of temporal data within GIS remains poor and that the incorporation of time into GIS remains one of the big challenges for the discipline.
From a temporal perspective, three types of data are commonly identified: temporal data, spatial data, and spatio-temporal data (see illustrations below).
As part of this thinking, many of the basic spatial features in GIS are described using different terminology. Point data may be time-bound and occur at particular instants or periods. Such point data are called events and examples might include the epicentres of earthquakes, the surveying of insects within a quadrat, or the event of sampling the quality of a water body. All of these points exist for a specified period of time. Similarly, line data may be referred to as ‘tracks‘ and represent vectors of movement and not simply static features. Examples of tracks might include the movement of deer as recorded using a radio-tracking device, the trajectory of the centre-point of a storm, or the walking of a transect by an ecologist. Each point along the line may include not only x, y, and z data, but also a time-stamp to indicate when an entity was present at that point. In much the same way, dynamic polygon features that change over time can also be identified, such as the extent of a bushfire, the boundary of a patch of bracken, or the limits of cloud cover.
Such dynamic features raise considerable challenges for GIS, both in terms of data storage and analysis. One particular issue in storage is that nearly all databases – including the spatial databases used in GIS – lag behind ‘real-time’. Some computer science academics distinguish between ‘real world‘ or ‘event’ time (when things actually happen) as compared to ‘database‘ or ‘versioning’ time (when things are recorded in a database). ‘Database’ time almost always lags behind ‘event’ time. Some authors also distinguish a third type of time –‘observation‘ time, when measurements of an environmental variable are taken. For example, a series of water samples may be collected from a lake to test its quality. There is likely to be a lag between ‘real world’ and ‘database’ time as this information is being computerised. There may be also be a lag of several years in ‘observation time’ before the water quality in the lake is surveyed again.
Clearly, incorporating the temporal dimension is more of an issue for some spatial data sets than others. Rapid environmental processes, such as changing weather or animal movements, pose greater problems than slower environmental processes, such as vegetation change, forest growth, or land cover change. For some data sets, such as underlying geology, soils, and elevation, the pace of change is normally sufficiently slow that only very intermittent updates are required.
Activity
How does time affect a GIS-based study of bird ecology?
Scenario: The corncrake (see references) is a bird that was once common throughout Europe, but owing to changes in farming practices, its range in the UK is now largely restricted to the Hebrides, Orkney, and the west coast of Scotland. Corncrakes migrate annually from East Africa to Europe , where they breed and nest in corn fields before returning south for the winter. In recent years, concerns have been raised about loss of corncrake habitat. A conservation trust have therefore collected some data on the spatial distribution of the corncrake and wish to create a habitat suitability index (HSI) for corncrakes from this data set. As a GIS consultant working for the trust, you have been presented with an outline analysis plan and a description of the data.
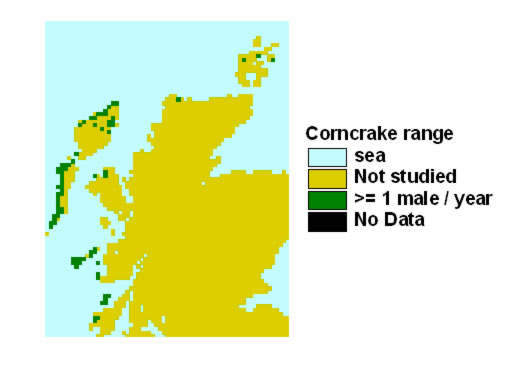
Figure 1: Corncrake range
Data & Analysis Plan: In 2003, a conservation trust undertook a study of corncrakes, surveying the core areas of the bird’s range. The distribution of the corncrake is represented spatially by the night-time cries of breeding males. Field ecologists record the locations where night-time calls are heard using GPS. To better understand habitat, this point map layer is overlaid onto a map layer depicting land cover. The land cover data source used is the Land Cover Map 2000 of Great Britain.
Task: Thinking about the time dimension to these data sets, can you identify any weaknesses in this GIS study?
Answer
From a time perspective, some of the weaknesses in the data include the following (there may well be others):
The land cover map and the corncrake data are from different years (2003 and 2000).
The land cover map and the corncrake data may well be from different times of year.
Breeding is but one part of a corncrake's behaviour. At other times of year (e.g. when nesting or foraging for young), the bird will interact with its habitat in a very different way – especially when in Africa!
The night-time behaviour of the breeding males is being represented as points, when the ideal situation would be to represent corncrake movement as a series of ‘tracks' or vector lines.
The survey data represent only one year's worth of observations on corncrake behaviour. Many bird populations are known to fluctuate in number between years because of variation in weather and other less quantifiable factors. The spatial distribution of corncrakes in 2003 may thus be very different from the bird's distribution in other years.
Although this is not described here, the movement of the field ecologists themselves could be recorded as dynamic ‘tracks'. Clearly, an ecologist needs to be present in order to be able to hear the corncrakes and the locations where an ecologist was present but did not hear a corncrake may be as important as locations where the bird was heard.
Hide
References (Essential reading for this learning object indicated by *)
* You can find out more about the Land Cover Map 2000 by visiting the Centre for Ecology and Hydrology’s web site: http://www.ceh.ac.uk/landcovermap2000.html
General Information about the corn crake: http://en.wikipedia.org/wiki/Corn_crake
The Royal Society for the Protection of Birds describe some initiatives for the conservation of corn crake: http://www.rspb.org.uk/wildlife/birdguide/name/c/corncrake/conservation_action.aspx