8.1 Web-based GIS: the design attributes
The Internet – A New Paradigm?
Given that the web-based delivery of geographical information carries a mix of advantages and disadvantages, what are its prospects overall? The internet in general has undoubtedly revolutionalised the ways in which people do business and undertake research or training. One of the unexpected consequences has been the creation of new “business models” based around online communities, ranging from mass online auctions and group buying to virtual discussions and E-democracy. Major growth of the web took place in the 90s which now links together diverse groups of individuals into online communities unconstrained by physical distance. So while the technology on which Web GIS runs has matured greatly, it is becoming evident that developing sophisticated interactive maps is only half the story. Given the high development and significant maintenance costs of web GIS, it is likely that only those sites that are able to serve the majority of needs of a clearly defined group will exist in the future. Increasingly spatial and non-spatial data used by decision-makers in government bodies are being made available to a wider set of stakeholders, including the general public. A nascent body of knowledge in “GIS for Public Participation” or GIS-P can be found on the internet, and such systems will often incorporate a web-based GIS. Furthermore, the development of an ‘open data’ movement in many countries (including the USA, Canada, the UK and Kenya, e.g. http://data.gov.uk/) provides an impetus for environmental bodies in government to release geospatial data in as raw a form as possible to the general public.
We can think of at least three ways in which the web is influencing environmental management:
- environmental managers and GIS professionals using the web to give the public access to their data
- members of the public using the web to develop and share spatial data with one another
- environmental managers and GIS professionals using the web to share data with one another (for example by exchanging data with one another).
Here, we will explore how environmental managers and GIS professionals use the web to provide wider public access to environmental data.
Providing the public with access to spatial data
It is possible to identify at least four main components in an environmental online GIS.
- User Communities (where both the provider and the client may be regarded as users)
- Datasets and Metadata
- Applications functionality – what does the system do?
- Enabling technologies
Each of these has to be understood and optimised if the web GIS is to reach its full potential, and they are separately considered below.
1. User Communities
A web-based GIS application still presents significant costs in terms of combined development and maintenance, although the per-use unit cost (cost of development divided by total number of users) may be relatively low. Unlike many other web applications, the most useful environmental web GIS will require data feeds from diverse organisations. To justify the costs, they must be able to identify a large or important community of stakeholders who will benefit from using the site – and who will bring direct or indirect benefit to the site’s sponsor. Political considerations may also be important in launching a project.
Case Study : Delivering biodiversity data online
Consider the National Biodiversity Network Gateway – an application run by the National Biodiversity Network charitable trust, a non-profit organisation established by various conservation organisations. You can link to this via the references below. The starting point in designing a web application, or reviewing an existing application, is to assess the user communities: who would use the site, under what circumstances and for what purposes?
Table 1. Metadata Snapshot (Geography Network)
| Content Summary: | Biodiversity information to support a wide range of conservation applications |
| Content Purpose: | To bring together geospatial data on species distributions from a wide range of data providers through a single clearing house |
| Content Themes: | Environment and conservation |
| Theme Keywords: | Surveys, Species distributions, censuses, Natural Resources Data, biodiversity |
| Place Keywords: | UK |
| Reference: | National Biodiversity Network Gateway |
2. Data and metadata
Geographical data lie at the heart of any GIS application. As users of web-based GIS, we are unlikely to have control over data selection or validation – but we can reasonably expect to be told how selection took place and what validation has been undertaken. As developers of systems, we need to win and deserve the confidence of our users that the data are fit for purpose (high quality). To do this, we must either ensure high absolute quality, or constrain the purpose (function) of the system so as not to exceed the capabilities of the available quality. The key in both cases is Metadata, which should provide a good indication of the currency, spatial coverage and accuracy of the datasets behind a web GIS, and perhaps even suggest what uses are and are not suitable with the available data.
We will use the example of the UK MAGIC web site. MAGIC (Multi-Agency Geographic Information for the Countryside) is a UK partnership project involving seven government organisations who have responsibilities for rural policy-making and management, and although it has been designed to meet the needs of the partner organisations, the facility is available to anyone over the Internet. The MAGIC partners are:
- Defra (Department for Environment, Food and Rural Affairs)
- Countryside Agency
- English Heritage
- English Nature
- Environment Agency
- Forestry Commission
- ODPM (Office of the Deputy Prime Minister)
The approach to metadata that is used by this web application is exemplified below with reference to a data set for World Heritage Sites which forms part of the Rural Designations group of data sets in MAGIC:
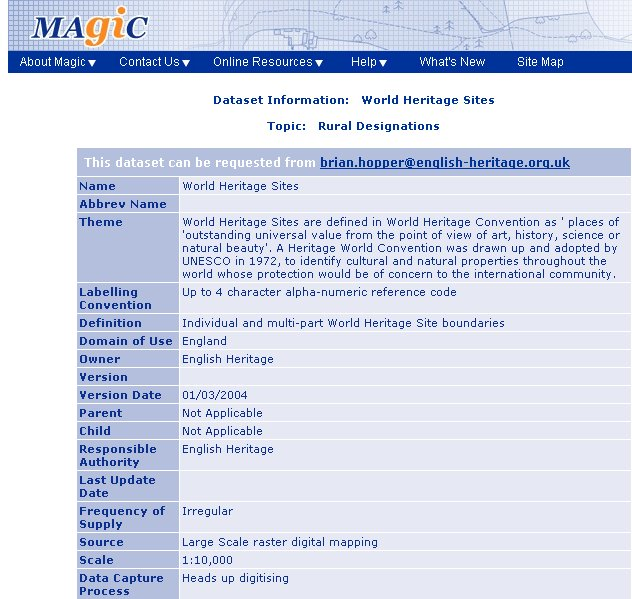
Figure 2: MAGIC screenshot of heritage sites metadata
3. Application Functions
It seems self-evident that the function of a web-based GIS application will be clear to those who use it and to those who sponsor and design it. In practice, this is often not the case. It is certainly possible to provide a simple typology of functions, and it may be possible for the sponsor/designer to select from this list a subset of target functions, but in the end the users will always be tempted to omit some of the target functions and invent some of their own. The designer can guide users towards “appropriate” use, but the risk of unexpected and possibly inappropriate uses remains real and worrying.
Table 2. Typology of web GIS functions
| Examples of function types | Implications and examples |
|---|---|
| Neutral source of data | A gateway to data with no guidance or value judgement from the sponsor. Examples could be weather data (how many days of rain in August at this location?) or a species list (what species have been noted within this area?). Can include “now” (real time) questions if the data set supports this. |
| A qualified source of information | The information is expressed against a known standard, but the sponsor does not add a value judgement. Which beaches meet the European bathing water quality standard? Which areas have been designated as SSSI’s? |
| Ability to query and combine datasets | Standard GIS functions, but often rather constrained in their web version. Show bathing beaches and sources of point pollution. |
| Select a dataset and use it as an input to a model | Often limited to specialist sites (or sites that expect their users to be specialists), and in practice the modelling capability is often more restricted than with the equivalent stand-alone systems. |
Perhaps the greatest risk is that non-expert users will apply data in a way that is not supported by the data quality. This is a commonplace problem, and often produces nothing more than inconvenience – for example, if we used a 10-day weather forecast to make an important decision for an activity in the future without checking for shorter-term forecasts as the day approaches. Occasionally, misconceived use can be potentially more serious, as with using an indicative floodplain map (the example used in the MAGIC activity above) to decide on the flood risk experienced by a particular house without undertaking a more detailed background study. In this example, the site owner (the Environment Agency) has foreseen this problem and created a careful prior knowledge approach to maximise the chance that users are alert to the limitations of the data.
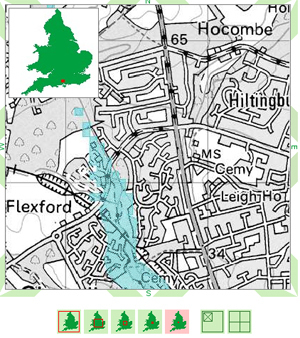
Figure 3: Screen shot of ‘What’s In Your Backyard’.
One of the benefits of Web-based GIS seems to be that they can simplify complex data and functions for the benefit of non-technical users. This has real advantages as long as the metadata are robust enough to avoid misleading or confusing the user. An excellent example is the “What’s In Your Backyard” site provided by the Environment Agency in England. This site is clearly designed to be understood by the non-technical user, although more detailed, scientific information is available when required.
This site enables homeowners and prospective buyers to gain access to information that has been available to estate agents for a number of years. The site offers a limited range of data, but a very user-friendly approach and a powerful set of metadata that make it clear how the information should be used.
4. Enabling Technologies
The actual technology used to run and deliver the web-based GIS application will have a direct influence on the nature and quality of the user experience (where, again, the user might be the client sponsor organisation or the end-user who is accessing the system). As always, there are trade-offs between cost and performance, and these are exacerbated by the expectation held by many end users that web services should be free at the point of use. There are also trade-offs between the functionality of proprietary systems and the merits of open standards, but the balance of advantage and disadvantage here is evolving steadily. Examples of Web Mapping Servers being used to power web-based GIS are given in the table below.
Table 3. Some major web mapping servers
| Application | Vendor | Reference link |
|---|---|---|
| Map Extreme | Mapinfo | https://www.pitneybowes.com/us/location-intelligence/geographic-information-systems/mapxtreme.html |
| ArcGIS for Server | ESRI | http://www.esri.com/software/arcgis/arcgisserver |
| Map Server | Open Source | http://mapserver.org/ |
Activity
- By typing its name into the ‘search for species or sites’ box, produce a distribution map for a species of your choosing (if you are unsure, you may wish to enter ‘chinese mitten crab’ – an alien species of crab (as large as a dinner plate!) whose range is rapidly expanding in British waterways). You should be able to click on the link to a grid map of records or an interactive map of records. Which of these web mapping display options do you think has the most flexibility?
Answer 1
As the name suggests, the interactive map does provide the user with rather more flexibility over the extent of the mapped area, as well as providing more contextual background data.Hide
- Can you see any limitations to these systems of delivering biodiversity data online?
Answer 2
You may be able to think of some technical limitations to the site's functionality. On top of this, there is a risk that despite the site's objective to bring biodiversity data together in a single site, it provides only a partial view of a species distribution if some organisations do not make their data publicly available. Necessarily, data are often generalised and more approximate when they are made available through a public access site like this.Hide
- Using the metadata table above as a starting point, make notes on 3 likely user communities for a system like this. Don’t be limited by what the metadata suggest: usage may be much broader than the designers expected!
Answer 3
Some examples of potential users for a site like this would be:- amateur naturalists, wishing to find out about local species distributions within their area
- academic and student use for learning, such as by ourselves here!
- professional organisations, such as conservation trusts and planners (e.g. those conducting environmental impact assessments) who may use the site as a first step in identifying relevant data sets held by other organisations for particular projects
Hide
Exploring data in the MAGIC Web Site
Before using the site read the MAGIC project summary about the site (referenced above), and follow any links necessary to provide you with a general understanding of the site’s purpose and organisation.
| Stages in accessing MAGIC metadata |
|---|
| On the MAGIC homepage, click on ‘data set info and download’ on the top panel of the screen. Select a topic (e.g. ‘habitat inventories’) and click on ‘Go’ |
| A list of data sets is displayed. Click on the link for one of the layers, e.g. ‘ancient woodland’. |
| The metadata summary panel is displayed. |
What sort of potential end users would be targeted by a site such as this?
Answer 4
The meta-data are fairly technical here, and in broad terms, whilst the MAGIC site enables members of the public to map and engage with data via the 'interactive map' and 'static maps' options on the home page (which you may wish to explore also), the download facility here seems more targeted at professionals within the environmental sector.
Hide
Usability and Functions
Critically evaluate the ‘What’s In Your Backyard‘ site for usability. For example:
- Is it obvious how to get something the system to work?
- Does it operate well?
- Is the layout clear and have they made it complicated when it could have been simple?
Answer 5
- Is it obvious how to get something the system to work?
Yes although I couldn't get it to recognise my post code.
- Does it operate well?
Yes, I liked the fact that you could click on all the squares of the scale bar to change the scale.
- Is the layout clear and have they made it complicated when it could have been simple?
Layout very clear, its easy to see how to get it to do things. There is no ability to click layers on or off other than to turn all the layers on or off at the same time. This is good design for a site that is designed for the public.
In general the site is not complicated and there is no technical terminology, but a great deal of useful information is imparted through simple spatial search and overlay techniques. There is very clear online help and metadata explaining capabilities and constraints of the data sets currently being viewed - this is particularly effective with the Indicative floodplain maps, which are inherently sensitive in terms of their ability to affect people's property values and sense of security if misused.
Hide
Criteria for selecting a web map server
Based on web-based GIS systems that you have used, which criteria would a web mapping server be judged on during the purchasing process within an organization?
Answer 6
Possible Criteria are: Performance (Roughly equivalent to the speed at which the map refreshes on screen), Reliability (does the system do what it says on the tin? Does it crash?), Scalability (can we expand the data it displays without rewriting the system completely), Cost (initial), Cost (Development), Costs (Maintenance), Interoperability with Open Standards (Can we import data produced by the system into other systems) , Usability (is it obvious how to get the system to do what it should), Richness of functionality, Availability of Specialized Skills (do users understand the principles of GIS), Integration with in-house datasets (Doesn’t this come under interoperability with standards?).
Hide
References (Essential reading for this learning object indicated by *)
Link to the National Biodiversity Network Gateway:
Links to the MAGIC web site:
Multi Agency Government Information for the Countryside (MAGIC) Website: http://www.magic.gov.uk/
MAGIC Project Summary: http://www.magic.gov.uk/About_MAGIC.htm