3.2 Data sources for elevation
A DEM is only as good as the data it is based on. There are many different sources of elevation data and this unit will run through the major types:
Photogrammetric methods
Photogrammetry is the science of taking measurements from aerial photographs or other remotely sensed data. The principle of elevation measurement in photogrammetry is very similar to that of stereo vision, where an object is viewed from two different angles simultaneously, allowing a distance ratio to be calculated by trigonometry. In photogrammetry, the two different views of an object are provided by two images taken from different positions. This may be two successive, overlapping frames taken during an airplane or satellite over flight, or even two images taken months apart, providing the land surface has not altered over the intervening period. The output vector data are points and / or contour polylines.
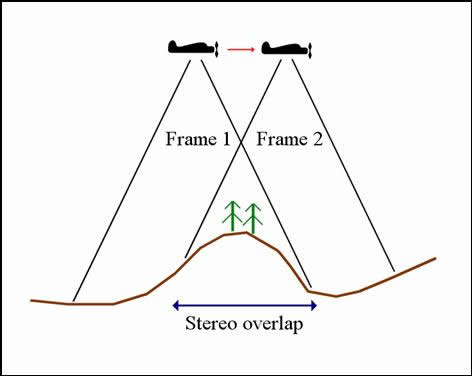
Figure 1: Cartoon of photogrammetry to produce stereographic images.
Within the area of overlap between the two frames, surface heights can be calculated relative to one another. Heights can be referenced to a standard datum if the height of a control point in the overlap area is available. A standard datum in this context is a ‘baseline’ height, such as mean sea level. All elevation measurements are then expressed relative to this standard datum. The use of control points of known height to calculate elevation across an aerial photograph is called ground control.
Ground survey
Ground survey is the oldest source of elevation data, traditionally undertaken by leveling and triangulation (see below). A ground survey allows the area of interest to be observed at close range, and the survey tailored to record the most relevant information, such as ridges, peaks and troughs. Whilst GPS technology now exists as an alternative to leveling, it has not replaced it in areas where high precision and accuracy is required. A ground survey should produce point data.
Leveling
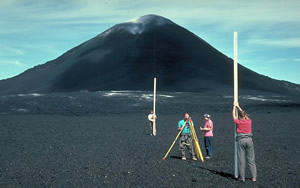
Figure 2: Leveling in the Volcanoes National Park. Click to expand. Courtesy of USGS.
The process of leveling calculates the relative positions of points surveyed by triangulating them relative to a network of local reference points, chosen for their visibility across the survey area. Angular measurements are made using a theodolite, effectively a telescope with protractors on its horizontal and vertical axes, or its modern equivalent, a total station (which is also capable of measuring the distance to an object). Taking measurements relative to a standard datum requires at least one survey point to be referenced to the datum. Despite the use of total stations dramatically speeding up the surveying process, leveling is still time consuming and only suitable for surveys of small areas.
RADAR
More recently, DEMs have also been derived from RADAR imagery, usually based on RADAR transmitted by aircraft. DEMs can be derived from radar imagery by looking at the phase of the radar signal (see below). Relative to other forms of remotely sensed imagery, radar has a long wavelength and it is possible to measure the phase of a received signal. Together with information on the aircraft’s flying height, this phase information can be combined with ground control data and used to calculate the elevation of the underlying ground surface, particularly where overlapping radar images are available for the same study area.
One of the most important radar-derived elevation data sets to have been developed in recent years came from the Shuttle Radar Topography Mission (SRTM) undertaken by NASA. A radar instrument was mounted on the space shuttle Endeavour and used to survey elevation lying between latitudes of 60 degrees north and 56 degrees south during the year 2000. The data product resulting from this mission was a publicly available DEM with a resolution of 90 metres (30 metres within the USA), first released in 2004 and refined in a second data release in 2006. Whilst this data set is extremely useful, there are some issues surrounding its use (Reuter et al, 2007):
- The SRTM data represent the Earth’s surface height rather than bare terrain and therefore includes the height of buildings, vegetation and other features.
- There are particular difficulties with the interferometry technique used to generate the DEM in areas of steep slopes and over water bodies, which can lead to areas that either lack data or have unreliable elevation estimates. These are known as voids, and some version of the SRTM data have been processed to eliminate these features.
LiDAR
Another new technology being used to produce DEMs is airborne laser scanning or LiDAR (LIght Detection And Ranging). In a LiDAR survey, an aircraft is chartered to fly over an area and sends out laser pulses towards the ground’s surface. A sensor onboard the aircraft detects the back-scattered laser signals from the ground and uses this information, together with positional data from a GPS onboard the aircraft to produce a DEM. The lidar instrumentation onboard the aircraft measures the time taken for the Lidar pulse to travel from the ground’s surface to the sensor on the aircraft. This can be thought of as a measure of distance and therefore ground surface elevation. The result of a airborne LiDAR survey is a pulse cloud, which can be thought of as a set of points. Typically, three measurements are attached to each point: a first return (the fastest travel time between ground and sensor, generated by the pulse hitting the top of a forest canopy, for example), a last return (the slowest travel time between ground and sensor, generated by the pulse hitting the forest floor, for example), and an intensity (crudely, the strength of the lidar pulse detected by the sensor). Crucially, by subtracting the last return from the first return, it is possible to measure vertical structures such as tree canopies and not simply ground elevation as a single surface. Lidar-based DEMs are becoming increasingly common in developed countries such as the USA, UK and New Zealand. Some examples are given below.
Paper maps
Many DEMs are created from contours and spot heights on paper maps, which are based on survey information or photogrammetry that pre-date digital storage techniques. To create a DEM, these paper maps need to be scanned and geo-rectified. When a map is geo-rectified, this means that it is registered to ‘real world’ co-ordinates. Instead of the positions of map features being registered in inches relative to the bottom-left corner of the page, they are registered using a known geographical reference system, such as degrees of latitude and longitude or Universal Transverse Mercator grid references. Contours and spot heights are then digitised. The output vector data are points from spot heights and polylines from contours.
Creating spot height and contour vector data sets from paper maps is a straightforward GIS procedure. In areas where the land surface is not changing rapidly this data source can be very cheap; in areas where the land surface is subject to change, maps and their revisions can provide a record of change through time.
This technique has been widely used by the US Geological Survey to create their national series of large scale DEMs (Continuous grids with a 30x30m cell size, referred to as the 7.5-minute DEMs).
Activity
Part 1: Follow the instructions in this pdf, which explains how you can download UK-based coastal elevation data from the Coastal Channel Observatory facility.
Part 2: By looking at the resources below or via your own online searches, pick an elevation data product. What is its country coverage, accuracy, and spatial resolution? How are objects such as buildings and trees handled? How much does it cost? Post up a quick message to the discussion boards summarising the characteristics of your chosen data product. When others have posted up, have a quick look and see how your chosen product compares with other elevation products described by other people.
References (Essential reading for this learning object indicated by *)
Here are some references to different sources of elevation data for the activity above:
As noted above, an international DEM has been produced for many parts of the world through the Shuttle Radar Topography Mission (SRTM) – see the ‘data sets’ tab and then ‘digital elevation’ in the left-hand panel here to download this product: https://earthexplorer.usgs.gov/
For more details of the SRTM data set, see also: http://www2.jpl.nasa.gov/srtm/
Further information on SRTM data is available through the following article:
Reuter, H. I., Nelson, A., and Jarvis, A., (2007) An evaluation of void-filling interpolation methods for SRTM data, International Journal of Geographical Information Science 21 (9), 983-1008
The US Geological Survey makes several different types of elevation product available through its site: https://eros.usgs.gov/products-data-available/elevation-products
The UK Ordnance Survey (national mapping agency) provide a DTM product called TERRAIN-5 http://www.ordnancesurvey.co.uk/business-and-government/products/os-terrain-5.html
In the UK, particularly England, the Environment Agency’s Geomatics Group have begun to distribute both DSM and DTM data at high spatial resolution at no cost for academic use: http://environment.data.gov.uk/. Alternatively, the LandMap data sets, which include 1m resolution DSMs and DTMs for British cities and 5m GetMapping and BlueSky DTMs can be requested from here: http://catalogue.ceda.ac.uk/list/?return_obj=ob&id=8049,8042,8051,8053 (note: there is no need to download these data sets for this module, but you may find it useful, should you wish to work further with DTM data in the future). Commercially, BlueSky’s elevation products are accessible here: https://www.blueskymapshop.com/, whilst GetMapping’s elevation products are accessible here: http://www.getmapping.com/products/height-data/height-data-getmapping.
The Environment Agency holds high resolution, LiDAR-based DEM and DSM data for many areas within the UK. Such data can be accessed through several different routes, such as their open data portal here: https://environment.data.gov.uk/ds/survey/ or (in the case of coastal LiDAR data) the Coastal Channel Observatory: http://www.channelcoast.org/.
Like the SRTM data set, the photogrammetrically-derived Aster GDEM product also has global coverage and can be downloaded from various sources listed here: https://search.earthdata.nasa.gov/search?q=gdem
A newer development, again with international coverage, is the WorldDEM product range from AirBus: https://www.intelligence-airbusds.com/elevation-models/