1.1 Data – an insecure foundation for environmental management?
There is a supposition – widespread in scientific circles – that decisions should be based on information, and that the better the data the better will be the decisions. There is a supposition – widespread in social science – that this is pious and sometimes dangerous nonsense and that most decisions are, and will remain, strongly subjective, intuitive and impulsive rather than objective. Somewhere between these two positions there is a valid and valuable role for GIS in Environmental Management, but it is a role that will combine elements of science and social science to a much greater extent than would be the case if we were simply looking at the role of GIS in Environmental Science. What we will find, therefore, is that when management is involved, GIS still functions as a technical tool but as one that exerts its considerable power through a set of social, psychological, economic and political drivers. Moreover, GIS cannot escape from these drivers or from their associated professional and ethical responsibilities. Like it or not, each GIS application is value-laden: it carries with it a set of implicit (and thus often covert) assumptions and priorities that relate to the value systems of the governments, agencies, corporations, societies or individuals that designed it and use it.
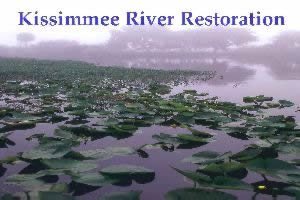
Figure 1: A picture of the Kissimmee River. Courtesy of USGS
As an example, follow the Saving the Kissimmee River link. At first glance it seems professional, well presented and, so we imagine, objective. Read a little closer and the objectivity begins to wear a little thin. Under the ‘Assessing the Land’ heading there is a ‘Visual Resources’ subheading where we are told:
EDSA adapted the Bureau of Land Management’s Visual Resource Management System to develop a model for assessing visual quality. This model used seven visual variables (landform, vegetation, water, color, adjacent scenery, scarcity, and cultural modifications). The model for visual absorption was based on six landscape variables (slope, soil stability and erosion potential, soil/vegetation contrast, vegetation regeneration potential, soil, and rock color contrast). A set of Visual Resources Rules of Combination was applied to the output of these two models in order to develop the Composite Visual Resources Vulnerability Map.
The language is scientific and begs us to believe in the model’s objectivity – there are ‘Rules of Combination’, a ‘rock color contrast’ (sic) variable and a ‘Visual Resource Management System’. But what we are talking about here is what places along the river look like. How can you put a number in a GIS representing the value of ‘rock color contrast’ (sic)? Different people have wildly different opinions on what looks good in a landscape; a trained geologist would be most pleased if there were plenty of areas of bare rock to interpret, a gardener would appreciate the variety of flowers and that’s before we bring in a range of artists to disagree about qualities of light, the pleasantness of the sound of water and the spirituality of any particular location.
While the GIS may have formed a useful tool to redevelop the river, claiming that it contains a layer representing an objective measure of visual value is clearly questionable.
We cannot (and, indeed, in many senses we should not) seek to detach the GIS application from its implicit values, but we can (and many would say we should, morally and professionally) seek to identify these values and make them explicit. Above all, we must consider at every stage in GIS design and application the ways in which data and GIS functions can easily take control of management decisions (even high level strategic decisions) rather than simply informing or supporting those decisions. This is not a new suggestion, or one that is restricted to GIS. Rather, it is a general observation on the relationship between decisions and actions on the one hand (whether operational, political or commercial) and the tools and technologies of investigating, specifying, informing and controlling those decisions and actions on the other. GIS is just one of these tools, and its implicit characteristics are as important as those that are explicit – which is a sophisticated way of saying that each GIS application has hidden attributes that can work against us as well as for us. It seems that GIS is a powerful but double-edged weapon in the fight for a better and more productive environment.
Such ideas are uncomfortable, even disturbing, to most GIS designers and users, and the preferred way of meeting their challenges and of solving the problems that they pose is often to ignore them and turn quickly to more familiar considerations of technology, function and information. Since this approach is similar to closing ones eyes when confronted with danger, a better option is to get to know the challenge – think of a “typical” GIS environmental management application, and list the ways in which it might influence decisions and actions in hidden and subtle ways that might not be apparent to the designer or formal end user. The following example is built around a deliberately-crude GIS for identifying areas to be prioritised in the response to a coastal oil spill: modern systems would not be this simplistic, but the principles of the argument remain valid.
The GIS will be a model that will allow managers to decide where to deploy oil booms to protect parts of the coast in the event of a local oil spill. With limited trained personnel and materials they will probably not be able to protect the whole coast from being polluted. The GIS will be built in collaboration with a number of stakeholders, who will feed in their views as to how the decisions should be made.
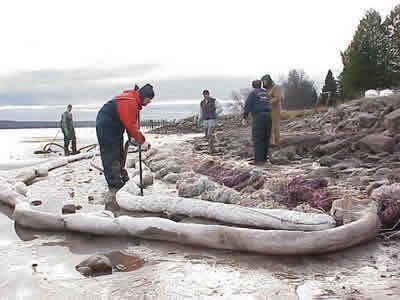
Figure 2: Defences protect a beach from oil damage. Note that oil booms can also be floating devices that could protect a cliff face from pollution as well as the beach version illustrated here. Courtesy of USCG.
Clearly, GIS application design involves many matters that are not simply technical considerations, and the GIS technical expert may be tempted to argue that such issues are for the client not for the system designer, developer or operative. This is a flawed argument: we all share in the responsibility for the outcomes of a system with which we are involved.
Subjectivity also impinges on GIS design and use in other more subtle ways, working at the policy or strategy level rather than the implementation level. Consider the following example:
The Priorities Trap
An example, based on river management, of the kind of context within which rigorous IT techniques applied to produce an “objective” index still leave major decisions to be taken on a subjective and value-laden basis.
Extracted from Clark, M. J., 2002, Dealing with uncertainty: adaptive approaches to sustainable river management. Aquatic Conservation: Marine and Freshwater Ecosystems 12, 347-363.
Scientists and managers have traditionally comforted themselves that they can conform to their standards provided that they apply the rules or assumptions absolutely objectively, even if it is grudgingly accepted that the rules themselves do indeed reflect social values. Subjectivity is allowed to creep in, provided that it is handled objectively! This pragmatic approach has worked well over several centuries, and it encourages the belief that there must be scientifically-robust ways (i.e. rigorous decision guidance) for setting priorities for investment in river protection or remediation. The argument suggests that provided that it is understood, at least approximately, how an environmental system works, and its present state is known, then it should be possible to identify its environmental needs sufficiently clearly to be able to rank them. Basically, it should then be possible to construct rules to set the investment priorities – and if this is the case, then it should be possible to encapsulate these rules within a decision-support system.
Although this statement of the position is greatly over-simplified, it does reflect some of the thinking behind the recent attention that has been paid in Europe and North America to the setting of environmental quality objectives (EQOs) backed up with appropriate environmental quality indices which can be used to yield the ranking that sets targets for action, albeit in a fuzzy context (Chang et al., 2001) , and then monitor whether or not sufficient progress is being achieved in this direction. This approach fits neatly with adaptive management, but it should not be accepted uncritically. It is relatively easy to come to terms with the fact that the indices inevitably build on subjective values, albeit assessments based on expert judgment and experience. For example, it really is a matter of judgment of what determines a top quality river, but once that judgment has been made then it can be encapsulated within “rules”. This entails identifying attributes that must be present; or measures that must be achieved, which can be applied consistently thereafter. The class boundaries may embody judgment, but once set they provide an objective framework within which to allocate individual rivers.
This seems to be a genuine move towards a scientific basis for prioritising management response and investment, but at this point a dilemma emerges that might be characterised as a “priorities trap”. Take the case of river channel habitats. If a habitat quality index is adopted that offers five classes from 1 (pristine) to 5 (ruined), how should this classification be applied in the best interests of society or environment? If the aim is to prioritise investment on environmental protection, it is tempting to assume that the hierarchy does provide a justification for prioritising: class 1 must be saved at all cost because of its high quality, while class 5 offers little if anything that is worth protecting. But what happens if the aim is to invest in river restoration? It might initially be suggested that the greatest need is presented by the class 5 rivers, and that this is therefore where the manager should sink the investment. But sink is a reasonable description of what would happen to the funding in many such cases: it would sink out of sight without any measurable environmental achievement since the conditions were so bad to start with.
The dilemma is clear and painful. Ideology and political expediency often suggest that investment for improvement should be focused on the areas of greatest need, namely the rivers of most degraded habitat (class 5). Pragmatism suggests that the greatest improvement per unit of investment is likely to be in rivers that are already reasonable (class 3 or 4?), and which with a relatively little effort could become high quality. Alternatively, it could be argued that the best investment would be in those rivers that were identified as lying close to a quality threshold, and where modest investment would move them up a class or prevent them dropping down a class. In terms of an annual “State of the Environment” report, investment in the mid-range or the threshold cases is likely to yield the “best” results. However, an inflexible application of these priorities could rebound negatively on the prospects for improving class 5 rivers, reducing the likelihood of winning remedial investment and making it more difficult to preserve such rivers against planning applications for activities that might be deemed detrimental on a river of higher quality. More sophisticated prioritisation would incorporate social criteria. Many poor quality rivers are found in urban areas where the social benefit of investment in improvement is extremely high.
From data to decision making
In part, the steadily-increasing role of GIS in environmental management relates to the operational context within which this management takes place. In many countries, there is a requirement that management in the public sector (which is where the environment is usually managed) should be:
- Consistent (which relates closely to concerns of equity: each management decision should be based on the same approaches and standards)
- Transparent (in the sense that sources and procedures are specified sufficiently fully to permit them to be understood by stakeholders – expert and non-expert)
- Accountable (which permits the transparent management systems to be monitored, reviewed and challenged)
GIS-based procedures support all three of these imperatives, and therefore fit well within an environmental management system. GIS is also particularly helpful in that it addresses the challenge of communicating sophisticated ideas to non-specialists through the visualisation that is often a core part of a GIS application.
However, there are two aspects of environmental management that are increasingly seen as professional and public challenges, and that remain problematic even with a GIS:
Our increasingly-detailed understanding of environmental systems, coupled with the acceleration of environmental change and the huge escalation in environmental legislation and regulation combine to make environmental management extremely complex. At the same time, changes in professional practice means that many decision-makers have less experience than was previously the case. The result is a search for systems (such as GIS) that can support complex decision making.
The second challenge is uncertainty, which has come to characterise much of the discussion about environmental management over the last few years. Neither managers, politicians nor other stakeholders like uncertainty when they are trying to be consistent, transparent and accountable, but it is unavoidable. Most GIS applications deal with “absolute” data, even when different variables may be weighted differently in a model or decision, but there are signs that fuzzy approaches and acknowledgements of data deficiencies are beginning to play a larger role.
This is the backdrop against which we will be exploring GIS in Environmental Management through this module and the following units. And to begin with, it is useful to look for the “meaning” of data by considering the concept of environmental indicators.
Activity
Table 1. Coastal oil-spill response priorities
| GIS design characteristics | Potential subjective implications |
|---|---|
| The model focuses on what variables such as bird populations, commercial fisheries stocks and coastal recreation value need to be protected. | 1 |
| Each variable is represented by key indicators. E.g. bird nesting site value may be linked to number of one species of bird nesting in a location rather than counting all the different species there. | The indicators may be unrepresentative: for example, recreation reflected in number of hotel bed nights “excludes” the interests of local residents, informal recreation, local sales etc. Data collection may be by a non-approved method. |
| Indicators validated with reference to international standards – standards that have been accepted as being useful when collating global data. | Local priorities may be quite different. For example, internationally rocky cliffs are designated as insensitive to oil spill, but locally they may carry critical populations of feeding birds. |
| Indicators are validated with reference to formal conservation designations | Formal designations may be weighted towards national and international rather than local criteria. The basis of the designation may not in itself be spill-sensitive. |
| The GIS produces a composite map of risk for the area | In practice, oil spill impact is contingent on local event-specific circumstances such as weather and oil type |
| The GIS produces a composite map of coastal sensitivity to oil spill | 2 (hint: think of how seasons affect the attribute) |
| The GIS is updated annually | Short-term changes (and their associated stakeholders such as summer surfers ) are excluded |
| The whole GIS system is authenticated by having been stakeholder consulted and approved. | Stakeholder representative structures at approval stage are likely to omit the same people and interests that have been excluded from influence in the component specifications above |
Think what should go in the cells marked 1 and 2 in blue in the box.
Answer 3
- Variables that are not chosen to be included in the model (e.g. birding or surfing) represent the exclusion of particular stakeholder interests
- In practice, sensitivity is often highly seasonal – this applies to recreation, plant growth cycles, fish breeding, bird migration etc.
Hide
As a concrete example of the ‘priorities trap’ described above, take a look at the Environment Agency for England and Wales here: https://environment.data.gov.uk/catchment-planning/
This site enables you to view or download geospatial data on the countries’ catchments and water bodies. Under ‘place-name’, search for Salisbury (a city in southwest England), then select the ‘management catchment’ of ‘Avon Hampshire’ via the link on the left. At the bottom of the next screen under ‘operational catchments’, you should find a link to ‘Avon Hampshire’. If you are not sure what an ‘operational catchment’ is, the Environment Agency provide a helpful glossary of such terms here: https://environment.data.gov.uk/catchment-planning/help/glossary. Click on this link and at the foot of this screen, you should see a list of the ‘water bodies’ within this catchment, with clickable links for data on each one. Take a look at ‘Clockhouse Stream’. You should find there is a year-on-year listing of its overall status (High, Good, Moderate, Poor, or Bad), which is itself driven by two components. One is its Ecological status (derived from many indicators, but including the diversity of invertebrates such as insects found there). The second is its chemical status, classified as good or fail: the classification system follows the European Union’s Water Framework Directive. Make a note of the main patterns.
Now go back to the ‘Avon Hampshire’ operational page again (use the right-hand ‘breadcrumb trail’ hyperlink at the top of the page). Now have a look at the catchment’s ‘Ebble’ water body.
- Which of the two water bodies is in better condition?
- Considering the ‘priorities trap’ discussion above, which would you prioritise for spending and what factors would you consider in making your decision?
Answer 2
The ideas I came up with:
- What could be achieved? Is there a project that with a little investment would make a big difference? For example, would Clockhouse Stream's remediation require negotiations or financial compensation for neighbouring land owners?
- Is there a problem which we are legally bound to address? In this case we have no choice at all.
- How many users would be helped by the development? Does Clockhouse Stream have more recreational or amenity value because of its location near to human settlement?
- Protecting something that once lost cannot be regained i.e. there may be a rare invertebrate in the Ebble water body that is in danger of disappearing completely unless protected.
- Stakeholder pressure. Our hands may be tied in that there may be a powerful stakeholder group (villagers living in the Clockhouse Stream area for example) who are putting pressure on the Agency to make the decision one way or the other.
- Precedent. There may be a successful scheme to improve an urban river elsewhere in southern England which you may wish to apply to your region.
Hide
References (Essential reading for this learning object indicated by *)
* Saving the Kissimmee River: http://esri.com/news/arcnews/winter0405articles/saving-kissimee.html
Further background information on the Kissimmee: http://sflwww.er.usgs.gov/sfrsf/presentations/strategies/scimgmt2.html