Gamer data: Fun preferences
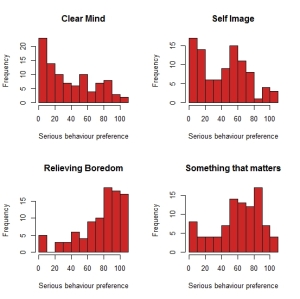
After last week’s hair-pulling day of frustration, I’ve made I bit more progress. The survey contained seventeen questions which were based on the theory of four types of fun, set out by Nicole Lazzaro. These were 101 point Likert scales, wherein the participant indicated their agreement with a statement, using a slider with no scale and the slider “handle” position set randomly, to reduce systematic bias. Of course, these being Likert disagree/agree scales, I was still expecting clumping at one end or the other despite my attempts to reduce that by making them 101 point scales. And so it proved, in many cases, as these histograms of the four questions I used as indicators of a preference for “Serious Fun” show.
I never intended to do any correlations with the responses to the individual questions though. Instead my plan was to average out each individual’s responses to the indicator questions to create something more like a continuous variable which I could correlate with other responses. Doing that for the responses to the Serious Fun indicator questions, for example, turns the four clumpy histograms above into something a lot more like a “normal” curve.
And the distributions of all four “Fun preferences” look like this (as curve plots this time, in case you were getting bored of histograms):
You’ll note straight away, that the “Hard Fun” curve is the one that most resembles a “normal” bell curve. Easy Fun has a distinct negative skew, and in fact all three others have a slight negative skew. And there’s a distinct preference apparent in this sample for Hard and Easy Fun over Serious and People Fun. In fact, the most popular preference in this sample is for Easy Fun where the mean stands at 70.8 and the median (in this most skewed of the four distributions) at 73.7. The mean of the Hard Fun distribution is 66.61, in third place is Serious Fun with a mean of 54.06 and trailing behind is People Fun with a mean of 42.22.
I was a bit surprised that People Fun scores so poorly in this sample, but I guess I shouldn’t be because one of the questions I used to indicate a preference for People Fun was “I don’t actually like playing games all that much” which I don’t suppose is going to find much agreement among gamers after all.
Which begs the question “would People Fun preference correlate negatively with the Ludic Interest vector I created last week?” But rather than look at that relationship on its own, lets see how all the derived variables I’ve created relate to each other.
So, people fun correlates a bit with Serious Fun, but little else. Ludic Interest correlates less well with Hard Fun than I might have expected. Though the Ludic Interest variable was admittedly an afterthought and the selection of games from which it was derived by no means scientific. I might rethink that whole section next time. The Serious Fun vector correlates with other variable more than I expected, and the little scatter plots look interesting, so next time I’ll investigate some of these relationships more deeply.


