Currently browsing tag

Statistics

My introduction to GIS

Having wrestled with the open source QGIS package a few weeks ago, my first attempt at modelling Portus in Minecraft, I decided it couldn’t hurt to give myself the introduction to GIS I so sorely needed. By happy circumstance, Esri, developers of the ArcGIS packages had just started a MOOC in conjunction with Udemy. So I signed up for that and, for the last couple of weeks, I’ve been catching up (I started four weeks late) and completing the course. Continue reading →

More maths

Last time I finished with this matrix of scatter-plots, ordered by the magnitude of correlation. But what does it actually mean? Lets take a step back, and look at those derived variables. I ask R to describe the table of variables that I created previously, which include the notional ludic.interest variable and the Hard, Serious, Easy and People fun preference variables. Continue reading →

Gamer data: Fun preferences

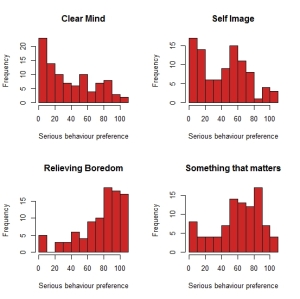
After last week’s hair-pulling day of frustration, I’ve made I bit more progress. The survey contained seventeen questions which were based on the theory of four types of fun, set out by Nicole Lazzaro. These were 101 point  Likert scales, wherein the participant indicated their agreement with a statement, using a slider with no scale and the slider “handle” position set randomly, to reduce systematic bias. Continue reading →

Bodiam data again

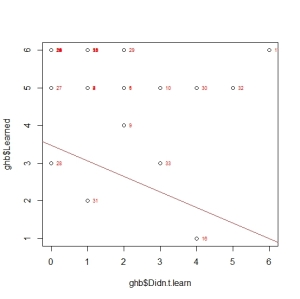
Yesterday, I said that I expected to see a strong negative correlation between “I didn’t learn very much new today” and “I learned about what Bodiam Castle was like in the past.” In fact, when I ran the correlation function in R, it came out at a rather miserly 0.33, much lower than I expected. So I asked R to draw me a scatterplot: And there it is, some correlation, but not as much as I was expecting. Continue reading →

Using R in anger

I’m expecting to be emailedl the link to my final exam in the Coursera statistics course this weekend, and by way of revision I’m using my own data in R for the first time. The first challenge is making sure my data is R “fit” – I entered it into Excel the first time, and though I made sure that even category data was entered numerically, I did some foolish things. Continue reading →