Electrical Resistivity Tomography on the Isola Sacra
Further to my last post, the week before last was spent with a team from the British School at Rome carrying out a single Electrical Resistivity Tomography (ERT) profile across part of the Isola Sacra, designed to complement the magnetometer survey of the area, and recent coring undertaken by Ferreol Salomon.

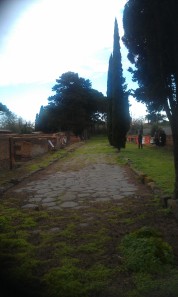
The Necropolis di Porto, showing the Via Flavia, between Portus and Ostia Antica. The ERT survey was carried out in an effort to cover the area of the necropolis, ancient road and dune cordon along the Roman coastline, together with the features including a large canal to the east of the necropolis
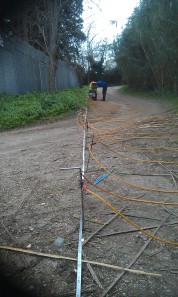
The profile ran from the westernmost point of the Necropolis di Porto in a north-east direction along one of the principal trackways of the Isola Sacra, along the edge of the fields established by the bonificazione of the area. Levels of readings were taken down to a depth of 7m to match the sediments recorded in Ferreol’s cores. The short field season highlights a useful way of targetting features found in the broader blanket survey of the landscape to aid our understanding of the depth and nature of features located in area datasets. Alice James and Matt Berry from the British School at Rome assisted in the survey on the ground, and are now hard at work processing this data and ERT data from some other projects conducted in the Autumn.
A preliminary look at the survey data shows that the tombs of the necropolis are indicated as high resistivity anomalies, although the road surface is not clear – perhaps indicating the robbing out of paving – and a high resistivity surface of material is visible running across the landscape to the east.

Data collection using the Tigre and laptop. Some battery life issues curtailed the work on the first day, although the heads-up imaging of the data as it is collected is useful in the field.
The data further to the east, in the area of the canal, is more difficult to assess on the basis of a cursory glance. The high resistivity readings near the surface have a double break in them, correlating approximately with the canal width. However, the sandy infilling sediment, and the sandier subsoil in the area, coupled with waterlogging across the survey area, has made visualisation of the canal profile difficult. Further processing and clipping of the data may give a clearer indication of the canal profile, and its relationship to the nectropolis and Via Flavia to the west.


