Another look at my gamer data
I’m still wrestling with R and wishing I was a natural (or maybe just a more experienced) coder. Everything takes so long to work out and to actually do. Last time I shared the results, I was just looking at the top-line data that iSurvey shares. This time I’ve downloaded the data and sucked it into R, the command line based stats language.
I start off looking at the basics. What is the size of my DataFrame (as it’s called in R)?
> dim(ghb)
[1] 193 89
> nrow(ghb)
[1] 193
> ncol(ghb)
[1] 89
There we go, its 193 by 89, or 193 rows by 89 columns. Now more that 200 people actually responded to the survey, but not everybody completed it, so to keep things simple, I only downloaded those who had completed it. But I discovered there were still gaps in the data, and here’s a case in point:
The first question I asked was a list of games, against which respondents could select from six categories:
| Never heard of it | Not played it and don’t want to | Not played it but I’d like to | Played it found it boring | Played it and enjoyed it | I still enjoy playing it |
When I composed this question I had two intentions in mind. Firstly, to offer a simple question to ease people into doing the survey, so they would be less challenged by the more esoteric questions I attempted later. Secondly, I just wanted to get an idea of the participants awareness of a number of different games and types of games. Thus the list of games was somewhat esoteric, with games I knew were popular, and games I’d only come across through my study. This is how that list appears in R:
[12] “Minecraft”
[13] “Red.Dead.Redemption”
[14] “Papa.Sangre”
[15] “I.Love.Bees”
[16] “Elder.Scrolls..Skyrim”
[17] “Cut.the.Rope”
[18] “Zombie.Run”
[19] “World.of.Warcraft”
[20] “The.Sims”
[21] “Just.Dance”
[22] “Ingress”
[23] “Dear.Esther”
I mentioned how the games compared in my earlier post. But since composing the survey I realized it should be quite easy to convert the categories into numbers and and total up individuals’ awareness of these games into a notional continuous numerical “game awareness score.” That might prove a statistically useful measure of a question I purposefully didn’t ask (which might have been: How interested in games are you? Not at all—–>Pro Gamer) against which I might be able to correlate certain play preferences, maybe even proving or disproving the oft-heard cry “Real gamers don’t play Angry Birds“! (An aside – I like this comic representation of a similar argument).
So after some frustration I come up these two lines of code for R:
ghb$ludic.interest <- round(rowSums(ghb[12:23])/72, 2)
hist(ghb$ludic.interest, col = “firebrick3″, xlab = “Notional score”, main = “Ludic Interest”)
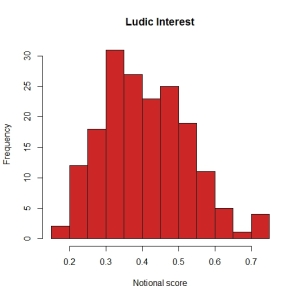
Which creates a new array of values(rounded to two decimal places) between zero and one (where one = “true gamer”), then plots the results in a histogram thus:
Not entirely “normal” but getting there, with a positive skew, but nothing too dreadful. A set of data I can work with.
Or can I? Because when I look at the values in the vector itself I find that a small number of values are coming up “NA”. Whats going on? It turns out that some respondents didn’t select any of the categories for some of the games. And if they miss out just one game, their Ludic Interest value is screwed. It’s not too bad for this vector, but I can only assume there are other questions, where other respondents have chosen not to select an answer. And I try to correlate those vectors with this one, more and more answers will come up “NA”.
What should I do? The easiest thing to do would be to remove any respondent who has has any missing data:
> newdata <- na.omit(ghb)
> dim(newdata)
[1] 94 90
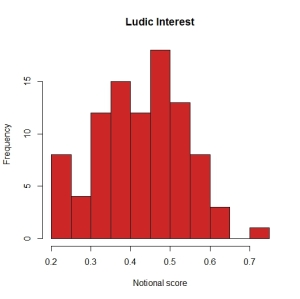
And bamm! At a stroke my sample size tumbles down from 193, to 94. How badly will that effect my analysis? Lets redraw that histogram with the reduced dataset:
Hmmm, a bit more comb-like, almost bi-modal. Worrying.
So, can I deal with the missing data in other ways, changing it to zero for example? That might be (just about) acceptable for converting the categorical data in this particular question into a Ludic interest score, but may not be acceptable for the other instances of missing data. Ohhhhh maths is hard!
Oh curse you, respondents! Why could you just have answered all the questions properly? And why didn’t iSurvey remove you when I asked it to strip out incomplete surveys?
This post on Stack Exchange is the most useful introduction I’ve discovered so far about the mysteries of imputation. But I’ll leave that for another day. In the meantime, I’ll work with my 94 complete responses.


