
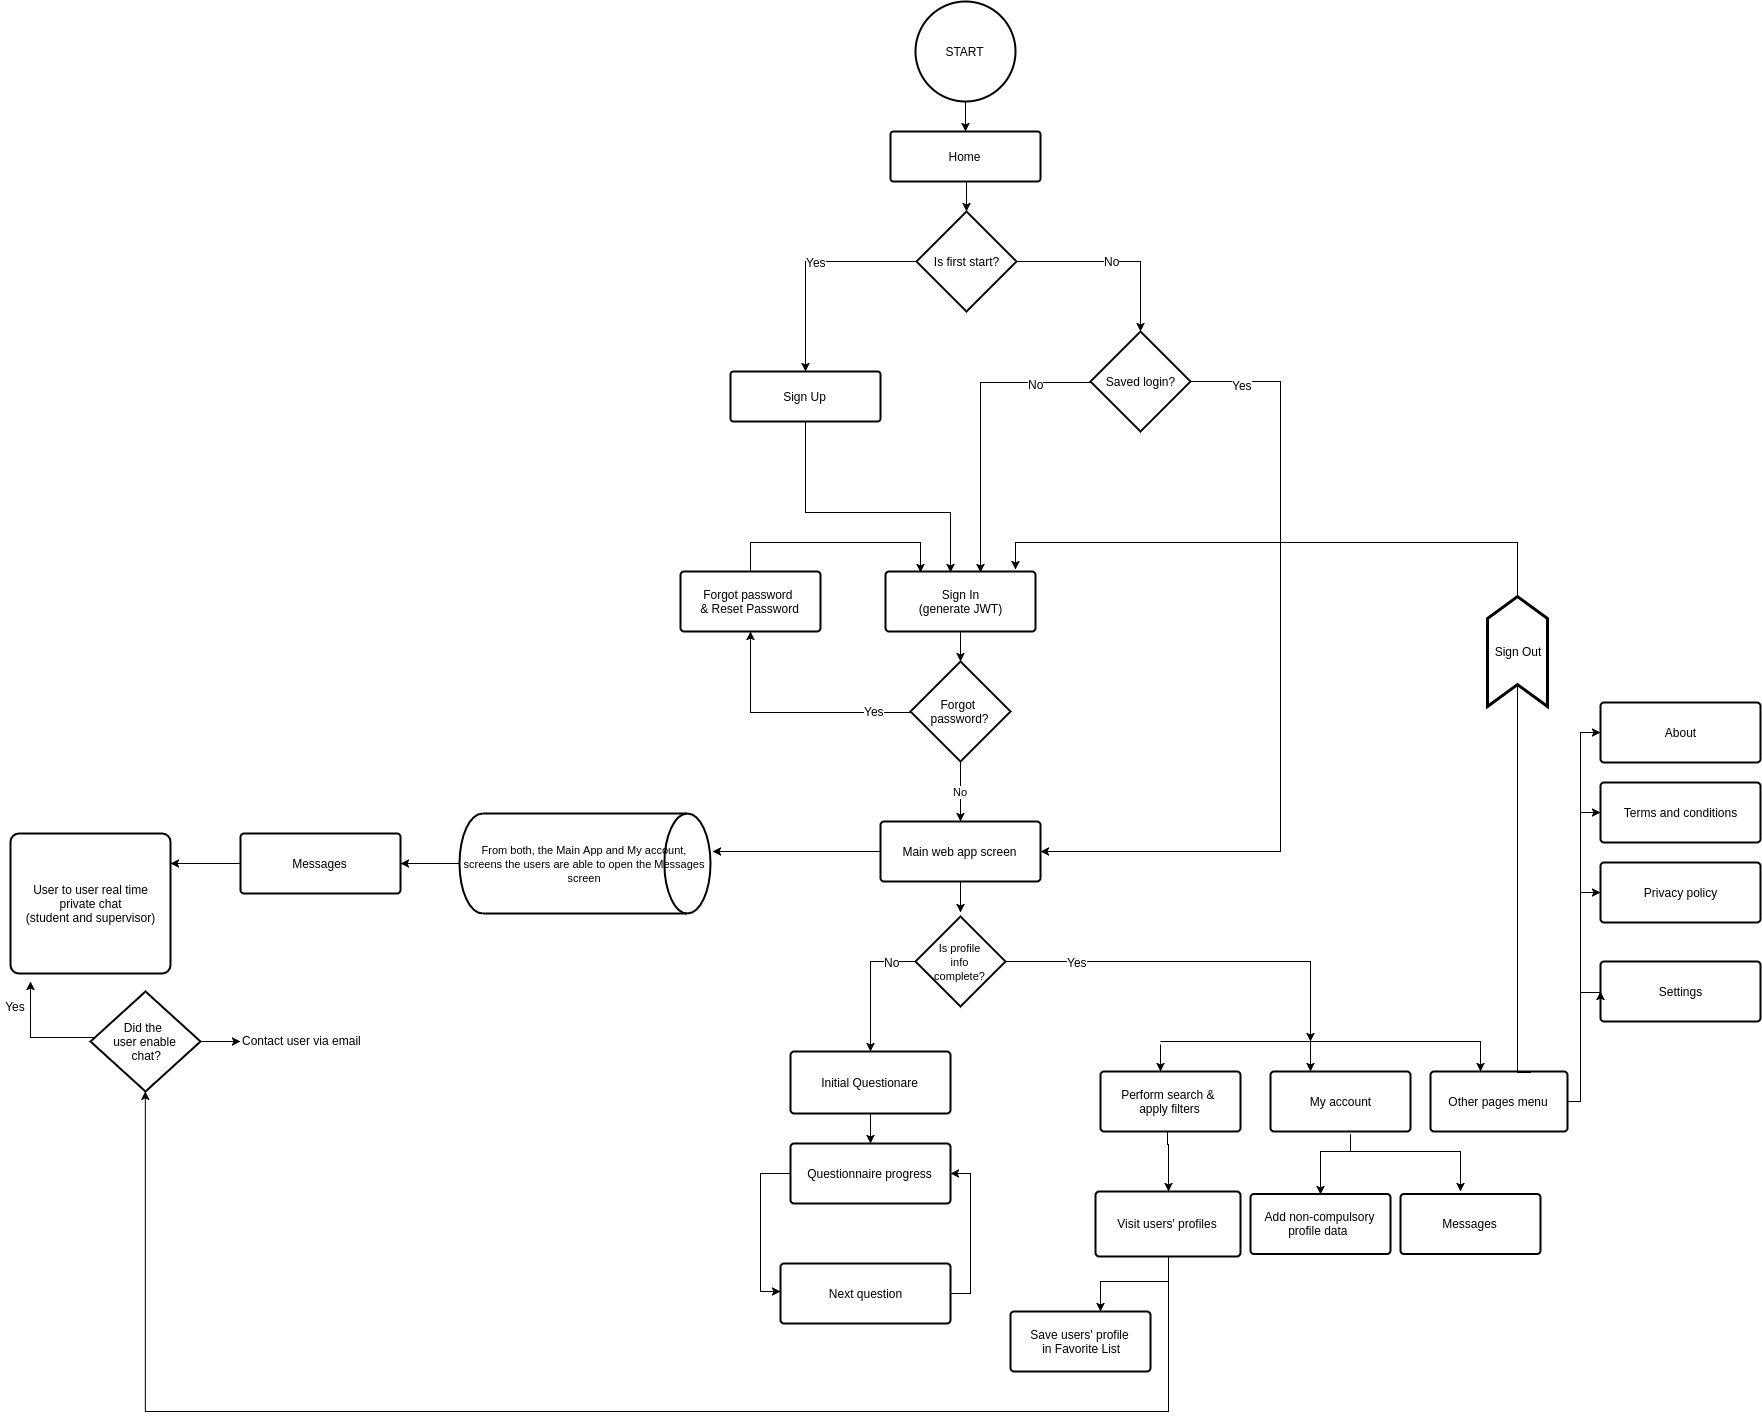
The featured image displayed above (for zoom, click the image) is a brief representation of the application flow. It is styled as a pseudocode graphic.
Each rectangle represents a separate screen and the arrow indicate the order of these screens according to the natural navigation of the users. The diamond shapes represent the critical steps. Depending on the fulfillment of the imposed condition, the steps will follow differently.
Author: Emanuela Colta