Graph Theory applied to the Social Network

NaviGap travel app is designed to facilitate interactions between networks of students travelling on their gap year and can be predicted and analysed using the mathematical language of graph theory in order conceptualise it in more abstract terms by representing individuals within the network as nodes and the relationship or connection between users as links (Barabasi 2002).

Screen Shot 2017-05-02 at 10.56.18


ALBERT-LÁSZLÓ BARABÁSI

A number of graph theory metrics can be utilised in analysis of the social network, for example, Degree centrality which measure the number of links (connections) into/out of the node (user) which gives an indication of the users’ influence and popularity by measuring node connectedness. Those users with more connections have a higher centrality and therefore can reach more people.

Users of NaviGap as they make use of the functionality, would be grouped together by their connections which would help to facilitate strong clustering between travelling companions and/or regular information seekers and providers.

An effect observed by Kossinets & Watts (2006), found that a shared focus (i.e. a community of travellers with a shared goal/ location) gives more opportunity for the formation of strong social connections or strong ties between people which results in increased levels of social capital. This can be defined in terms of frequency of interactions between pairs of users, reciprocity of communication,  and the interaction type.  We believe that fostering strong clustering will benefit users in providing more relevant information and in building traveling companion relationships making the travel experience more rewarding and potentially safer. This may be of value to socially / geographically isolated students that wish to embark on a gap year.


References:

Barabasi, A. L. L. (2002). The New Science of Networks. Cambridge, MA: Perseus Books.

Coleman, J. S. (1988). Social capital in the creation of human capital. American journal of sociology, S95-S120.

Kossinets, G., & Watts, D. J. (2006). Empirical analysis of an evolving social network. science311(5757), 88-90.

Mockups and Prototypes

App product teams need mockups to present their vision and views of the final product and that is why here, in NaviGap, we use top tools to present best UI solutions.

In this post, we will present our mobile screen mockups to show the basic functions of our outlined scope.

Why prototype

No secret, that there is no perfect User Interface which will be explicit, intuitive and efficient for all users. However, close to perfect is possible and achievable with countless efforts, many hours of work and constant improvement. Thinking and interacting with your app just like your user is the key. A prototype is not a final product, it is the field for improvement and work. It starts with simple sketches and gets augmented by adding features, links, interactions, design improvements on its way to perfection. Prototypes allow prototypes allow us to test the feasibility and usability of our designs before we actually begin writing code. They allow to actually test and play with various user interactions scenarios.

Imagine

Sketching an app helps to ‘feel’ the actual thing and maximise ideas if only on the paper. Various techniques from pencil sketches to post-it notes dashboard can be used. We used a simple sketch to get the whole picture and then moved to available prototype tools to implement click-throughs interaction.

mock

Figure 1. A sketch of what we wanted

Click-Throughs

Then, we used JustinMind software to build our prototype and show our user interactions with it.

Here is the basic interaction map:

Picture1

Figure 2. Interaction map

Figures 3-6 show the initial set of Navigap screens simulated on iOS. Interactions are listed according to user action and marked with blue circles.

   Picture2

Figure 3. ‘Main_screen_feed’. Main screen with latest expert feed

Interactions:

4 on Click:   goes to ‘Q&A_with_experts’ with effect: pop

5 on Toggle:   goes to ‘Location_on_map’

6 on Click:   goes to ‘Expert_story’

7 on Click:   goes to ‘Expert_story’

8 on Toggle:   goes to ‘Location_on_map’

9 on Click:   goes to ‘Q&A_with_experts’ with effect: pop

Picture4

Figure 4. Q&A_with_experts. Interaction with expert users

Interactions:

2 on Click:   goes to ‘Main_screen_feed’


Picture5

Figure 5. Expert_story. Extended travel story of an expert user

Interactions:

1 on Click:   goes to ‘Main_screen_feed’

Picture3

Figure 5. Location_on_map. Extended map of chosen destination

Interactions:

1 on Click:   goes to ‘Main_screen_feed’

The interactive simulation can be accessed via the link: https://www.justinmind.com/usernote/tests/25458829/25462335/25465092/index.html

Final thoughts

We understand that our highest priority is the user and making their experience pleasant and fun in lines with our goals is a challenge. However, using different approaches, tools and techniques to reach the ultimate App prototype is something we take seriously within our team.

Mobile App Research


waving man


Mobile apps access a lot of data and are now thought to be integral to many individual’s daily life. They are thought of as an asset or an extension to daily life and can hold a lot of data about individuals, such as location data in travel apps, that can be used to enhance user experience and to customize it.

How it affects us

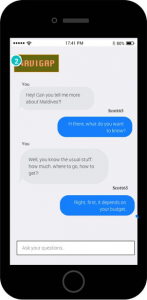
The first social network appeared in 1997 (Boyd and Ellison, 2007) and since then they have grown exponentially . As our app will also be a social network, the aim is to build trust and ensue the usability of the ap, ensuring the best user service. Online personas are a big factor, anything that can be done to enhance this persona is something to be valued. Our app will enhance the online persona of the  individual, by tailoring it to the specifications and persona of the individual and to ensure it is not a generic user experience. (Harper, 2014)

Apps are now integral to online life but they also enhance an individual’s offline life. This growing app world provides users with vast amounts of information but also to dedicated services, (Kugler, 2016). It has revolutionized ways to communicate, share and create (Harper, 2014) this is why the use of travel apps has grown and the need for them has increased.*

As this CNN article points out, mobile apps are used by many as a substitute for their computer, therefore they wish for everything to be as easy and accessible as it would be on their computer.

Article:

http://edition.cnn.com/2012/03/20/business/travel-apps/

So what does this mean for our app?

There are always opportunities on the App market, but to truly harness this, ideas must be unique, original and created with users in mind. Apps may one day be the main force of the Web, a connection between online and offline life. Travel company’s and developers are harnessing this potential and understanding that is the next direction for travel if they wish to excel against competitors and be a force in the market (Morley, 2014). This is great news for us as we are able to take our unique idea and user this growth in the market for our benefit.

App’s not only provide content and services, but they break down barriers between users, and provide for a more tailored approach to marketing and advertising. (Richard and Harper, ) Technology is seen as a way to inform and engage and to also bring other closer together. (Dalstrom et al ,2013) The difficulty in developing apps is there isn’t a ‘standardized platform,’ (Heitkotter et al, 2013), therefore in order to be able to ensure saleability the use of advertising and sponsors is integral and to also ensure the freedom for our users when using the app and to not stifle progression in continual development.

hit the nail on the head

Evolving Technology and Saleability 

In order to maximize the benefit of the app market, there needs to be a saleable idea that can be translated through to potential users. Even if the app starts off as being free, in order make money from it it has to appeal to as many users as possible. Society is also susceptible to influence, so the more people who like and recommend the app the more likely it is to transcend past a few users and to reach a target market, (Cheng et al, 2017).


In fact many would say that a main draw to using smart phones is the ability to access so many things in app form (Morley, 2014). This efficiency is important and is why travel apps in particular do so well, developers know that people want to travel around, and as easily and stress free as possible. This then paves the way for more and more travel related apps to make sure people travelling have little to nothing to worry about (Molloy, 2013). Apps available free of charge or for a nominal amount mean that they can access a wider audience andare more readily used. (Morley, 2014) .The app market is very versatile and with the use of revenue from marketing and advertising and sponsors, free apps are more and more common.

Also the good thing about app development is that it is constantly evolving and changing to meet new demands, trends and technology, (Kugler, 2016). Also more than ever with this increased development, even if an app is on the same creative lines as another app there is still enough room in the market, people like trying different apps and also are susceptible to the newest app that comes in to the app store (Briz-Ponce et al, 2016). This means that with constant development it is the older apps that must appeal to their users in order to retain them, to keep up with the evolving technology and create new things, (Chen et al, 2017).

What the app offers is also important, to have a diverse range of options is important, whilst also sticking to what the function of the app is. An app can deal with simple daily tasks or more specific needs, such as travel apps. If there is enough need in the market this can set app developers apart. Knowing what functions the app will have is important as it will ensure a direction for the app, but also continually think of new ways to develop the app is also important to retain user interest (Molloy, 2013).

As highlighted by a recent article (EBSCO, 2017**) mobile apps have been valuable to the UK’s economy and the market grew by 0.9% in 2016 and is only set to continue with an increase of 46.6% 5 years. This predicted rise is due to the growth in the market that has been shown and its continued use and the still growing need for apps. New phones are released even more often than they were before and apps have to keep up to date with the new features on smart phones. This is true for all app developers from big companies to individual developers. This rivalry pushes even more creation and innovation and helps to facilitate growth (Molloy, 2013).

References:

Boyd, d. m. and Ellison, N. B. (2007), Social Network Sites: Definition, History, and Scholarship. Journal of Computer-Mediated Communication, 13: 210–230

Briz-Ponce, L, Juanes-Méndez, J, García-Peñalvo, F, (2016) Book of Research on Mobile Devices and Applications in Higher Education, IGI Global Books.


Chen, Q, Zhang, M, & Zhao, X (2017), ‘Analysing customer behaviour in mobile app usage’, Industrial Management & Data Systems, 117, 2, pp. 425-438, Business Source Premier, EBSCOhost, viewed 29 March 2017.


Dinsmore, J, Swani, K, & Dugan, R, (2017,) ‘To ‘Free’ or Not to ‘Free’: Trait Predictors of Mobile App Purchasing Tendencies’, Psychology & Marketing, 34, 2, pp. 227-244, Business Source Premier, EBSCOhost, viewed 29 March 2017.


Heitkotter, H, Hanschke, S, and Majchrzak, T, (2013) Evaluating Cross-Platform Development Approaches for Mobile Applications, Available at: http://www3.nd.edu/~cpoellab/teaching/cse40814/crossplatform.pdf


Harper, R. (2014), Trust, Computing, and Society, Cambridge University Press.


Keengwee, J, (2013) Pedagogical Applications and Social Effects of Mobile Technology Integration, IGI Global Books


Kugler, L, (2016), ‘Smartphone Apps for Social Good’, Communications Of The ACM, 59, 8, pp. 18-20, Business Source Premier, EBSCOhost, viewed 29 March 2017.


Molloy, S, (2013), Appvertising – How Apps Are Changing The World, Amazon Digital Services.


Morley, D, (2014) Engrossed in social life. Understanding Computers in a Changing Society, 6th Edition, Course Technology.


**Why pay for apps And ‘Mobile Apps in the United Kingdom’ (2016,) Mobile Apps Industry Profile: United Kingdom, pp. 1-39, Business Source Premier, EBSCOhost, viewed 29 March 2017.


*http://www.nbcnews.com/video/travel-apps-that-will-save-you-money-on-the-road-719410755787

Agile versus Waterfall

        main-qimg-58816439e3c075a5b8bebbba6131cf5b-c

Figure 1. How Projects Really Work

In this post, we would like to discuss how we envision our development process philosophy and which approach we plan to use. As can be seen in Fig.1, the vision of a project is not always the same (completely different) to its final release. Thus, it is very important to choose the appropriate development strategy and stick to it during the project’s lifecycle to deliver the best solutions.

Different approaches

In the case of web development process, there are generally two approaches: waterfall and agile. What are the main differences between them?

  • Waterfall process is when each part of the project is done sequentially by a team member and passed along the assembly line after the part is finished.
  • Agile process is a simultaneous working approach when each member of a team contributes to the project in the same time frame.

In short, here is a simple explanation of both:

 Video 1. Workflows: Agile vs. Waterfall

After considering the pros and cons of given approaches, we chose the agile model for the following reasons:

  • Short iterations (time frames) of development work mean fast delivery and constant up-to-date with current issues. Our product is for young and innovative people and we need fast solutions for emerging problems, and small increments of work provide convenient development pace for our product.
  • Our small team has representatives from all stakeholders, so conducting Scrum meetings would be an efficient collaborative process where interests from each side are not neglected.
  • Feedback is prompt and corresponds with each iteration directly.

Q. How does it work on a daily basis?

A. Scrum Power!

Video 2. Short explanation how Scrums work

We will be using the Scrum Agile methodology as it has proved to be effective and applicable to various project types.

Basically, each of our sprints (a specialized term for iterations) will consist of several steps:

  1. A product owner  –> creates –> a to-do list with noted priorities which is a product backlog.
  2. The team –>takes–> a small piece of that to-do list from the top, and discusses implementation.
  3. Our sprints –>last–> 3 to 4 weeks to complete that piece.
  4. Meanwhile, the team—> has –> daily scrum meetings to discuss and assess the progress of work to be done.
  5. The ScrumMaster —>is–> the master brain behind those organised scrum meetings. They keep the team aligned and focused on the goals.
  6. Each sprint —>ends —> with a deliverable product, thus showing an achieved goal to a stakeholder.
  7. A sprint review and retrospective —> complete the cycle of each sprint and maximise the feedback effect in order to improve a next sprint delivery.
  8. A new chunk of backlog is taken into work and the iteration cycle starts from Step 1.


In our vision, Scrum is a flexible and efficient web project management framework which enables the team to react more quickly and respond more accurately to the arising issues. Scrum’s holistic nature minimizes marginal risks and allows our App product to adapt to changes just in the right time.

NaviGap UML diagrams

In this part, we will talk about our development model views described in Unified Modelling Language. UML is a language which we will apply to describe use cases meaning the interactions of an actor (user) and a system to achieve certain goals. This is an in-between process: after we gathered all requirements and shaped our agenda and before we actually started coding.

Our app users

In previous posts, we identified our user personas. Now we can proceed and implement those personas into our interaction use cases. It helps us to identify the functionalities we want to offer to them. We don’t have to cover now the scenario of a registered or authenticated user, but we will treat as a seperate diagram.

Our app functionalities

Now we identify general functional blocks we offer for the actors (personas) aligned with activities they perform.

The First Persona is identified as a novice who comes for social value and expert advice. is clearly interested in

The Second Persona is an expert who was a novice at the beginning, but after a certain amount of contribution (posts, advice, photos etc.) became an expert (high degree of centrality) and can provide help/advice/guidance to novices.

Finally, the Third Persona is a commercial partner type of user who is interested in business add-on value.

Three iterations are needed to reach the outlined use case scope.

Figure 1. Use Case Diagram: NaviGap interaction

At this point, we can augment the Persona 1 case by expanding each functionality. For example, ‘Seek travel inspiration’ functionality:

Figure 2. Use Case Diagram: Augmented functionality

Through each augmentation iteration, we ask ourselves: is it enough? have we listed all possible functionalities that we can release? Step by step we will augment our UML layout and add blocks to each functionality. After each functionality has a detailed list of sub-functionalities we can look at it critically and think of additional features that will give us a competitive edge.

Our app communication diagram

As an example of UML communication diagram, we show the scenario when a user wants to login into their account. That provides a model-view-controller perspective of interaction.


Figure 3. Communication Diagram: Login

Our app state diagram

State diagrams can be seen as the essence of object-oriented programming (OOP). Those diagrams are good when we want to describe the behavior of a single object. In general, those diagrams define various states of an object during its life cycle.

A state diagram represents the actual changes in state, not the particular processes/commands creating those changes.

Figure 4. State Diagram: Novice User object


Why we need all those diagrams?

We assume that our team should have a clear understanding how the users interact with the App, what functionalities we are planning to offer to them and in what way they can access them. Overall, each diagram builds up a clear understanding of what is expected from the app, what role the users and other actors play in it, and helps to shape the outline of the UI design.


NaviGap Development Costs

NaviGap Development Costs:

The primary factors that we see as influencing the development costs of NaviGap include:

  1. Monetisation Model
  2. Platform
  3. Functionality
  4. Design
  5. Research
  6. Developer

1.Monetisation Model

It would be easier and more straight forward to create an app that is simply sold for a fixed, upfront price as opposed to one with In-app purchases that will require continuous updating to the software. We have decided on a blend of models that will include in app purchasing therefore long term costs of development need to be factored in.

2. Platform: Android Or Apple

iphone map
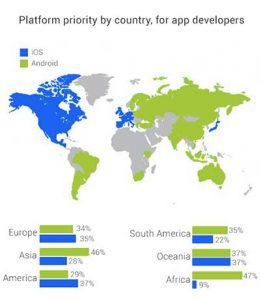
It is possible to build an app that is accessible on a number of devices: iOS (iPhone and iPad), Android, Windows Phone, the Web or one that can be used on all of them. The price of development will vary accordingly. At this stage we are only considering mobile apps however, and therefore our options are either Android or Apple. We have determined that our app is to reach a demographic of 18-25 years olds so JAMR researched which platform would best suit this.

Image from blog.mobiscroll.com.

Each one of the aforementioned platforms requires a particular programming language, different development environments and programming models based on platform-specific APIs. For example, developing applications for Android requires Java, while developing applications for iOS requires Objective-C. It is apparent that, if a company decides to support both Android and iOS platform, there is a constraint to maintain two versions of a single product: one version implemented with Java for Android and a second version implemented using Objective-C for iOS. Mobile cross-platform tools (CPTs) provide an interesting alternative to native development. Cross-platform tools aim at sharing a significant portion of the application codebase between the implementations for the different platforms. This can drastically decrease the development costs of mobile applications. (Willocx ,Vossaert , Naessens, 2016).

JAMR intends to use a CPT to generate an app for both IOS and Android.


3. App Types & Functionality

The technical specifications of the app will be the single biggest factor in its cost. App types down into the following four categories:

  1. Table/List – designed primarily to display a relatively simple collection of information
  2. Database – designed to allow users to find, sort, and display data from data sets
  3. Dynamic – designed to cooperate with other platforms and software via APIs.
  4. Games- designed to be dynamic and have advanced features.

The more complex the functionality, the expensive the corresponding development cost will be. Quotes will need to be solicited from multiple developers, however, JAMR plans to develop the app ‘in house’ using our teams software development skills thus reducing the cost of development.


4. Design:

The design is an important feature of the App, particularly in terms of attracting a user to the initial download since customers are attracted by an icon and/or design. Similarly, design can make them want to use the app more, NY Times 2015.

A compelling design generated from a proven design team with a consumer-tested portfolio, could be very expensive. JAMR need to budget and prioritise based on the young person target audience who potentially are very design sensitive, therefore priority will be given to a high end design.


  1. Market Research:

The traditional questionnaire survey incurs a great human and financial resource. Whereas an online survey system could immensely cut the costs of questionnaire printing and labour in terms of service fees for interviewers, travelling expenses and data entry fees with a fixed cost will be paid that includes questionnaire design fees, network expense and data analysis service fees.

Other advantages of web-based questionnaires are:

  • Automation and real-time access.  Analysis is easier, and available immediately.
  • Convenience.  Respondents can answer questions when they want.
  • No interviewer.  No influence from the interviewer, means less bias.
  • Target PopulationThe sample may prefer just online surveys.

Therefore, a web-based questionnaire could replace the traditional paper questionnaire with minor effects on response rates and lower costs, potential disadvantages being a lack of respondent cooperation in terms of internet uses receiving lot of feedback requests, and the lack of interviewer to clarify respondent queries could mean that data collected is less reliable. (Hohwü, 2013).


6. Developer: Freelancer vs Agency

Different apps vary widely in developmental cost and there are 3 basic categories of developers you can choose from:

  1. Freelancer – affordable option
  2. Small agency – specialists in specific areas
  3. Large agency – big brand guarantees

Clutch surveyed representatives from 12 leading mobile application development companies to determine cost ranges of building an iPhone app and the key variables of cost and found that the median cost  range is between $37,913 and $171,450, but could be as much as $500,000.

NaviGap however will be using JAMR’s ‘in house’ software developer on this project.


Hohwü, L., Lyshol, H., Gissler, M., Jonsson, S. H., Petzold, M., & Obel, C. (2013). Web-Based Versus Traditional Paper Questionnaires: A Mixed-Mode Survey With a Nordic Perspective. Journal of Medical Internet Research15(8), e173. http://doi.org/10.2196/jmir.2595