User Surveys

JAMR distributed an online survey in order to collect information from potential app users in regards to their needs and preferences.

Following ERGO ethics committee authorisation, the platform Survey Monkey was implemented to set up an online survey with a variety of nine multiple choice, sliding scale or open ended questions.

The survey URL was emailed out to the student population of the University of Southampton who fall into the user profile demographics of our design.

The responses were analysed and are discussed below.


Question 1. Your Age.

survey Q1

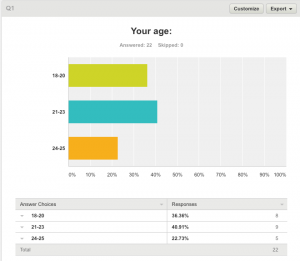
Data suggests that interested users of this app are within the age category of 18-20 (36.36%) and 21-23 (40.91%) with some users aged 24-25 (22.73%).

This matches our predicted demographic of users and aim to market the App at the 18-25 age range, focusing on University students.


Question 2. Your current level of education.

survey Q2

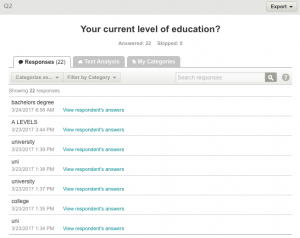
Data suggests that interested users of this app are currently studying or are about to commence study at degree level.

This supports our intention to market the app at University students.


Question 3. Do you have any travel experience before you started university degree?

survey Q3

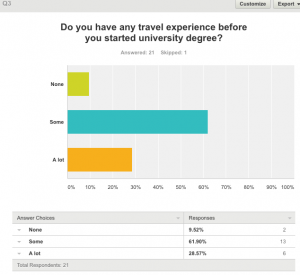
Data suggests that majority of interested users of this app have some travel experience (61.9%) with almost one third of users having a lot of experience.

This data has justified our responses have come from users with experience that can better suggest travel app solutions and those who are more likely to use the app itself.


Question 4. When do you use the internet when searching for travel inspiration?
survey Q4

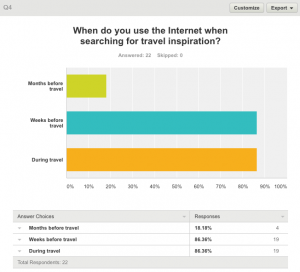
Data suggests that interested users of this app search for travel inspiration in the weeks prior to travel and during travel (86.36%).


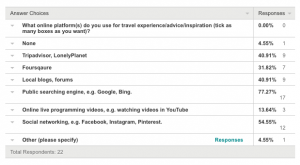
Question 5. During travel.
Survey Q5a

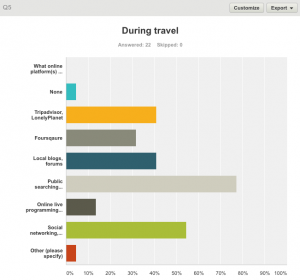
Data suggests that interested users of this app mainly use online public searching platforms such as google and bing (77.2%) whilst travelling, or social networking sites such as facebook (54.55%).

The ‘Other’ response was Twitter.

This suggests that there are no travel specific social networking platforms currently being used.


Survey Q5b


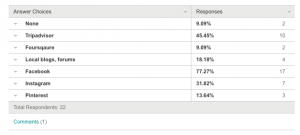
Question 6. What online platforms(s) do you use for travel socialising and sharing?

survey Q6

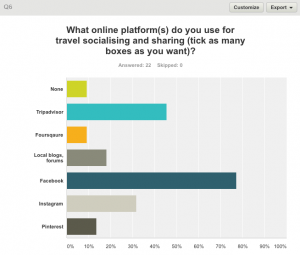
Data suggests that interested users of this app rely on facebook (77.27%) and TripAdvisor (45.45%) social networking platforms for travel based information sharing.

This suggests that there are no travel specific social networking platforms currently being used.


survey Q6b


Question 7. How often do you use mobile apps?

survey Q7

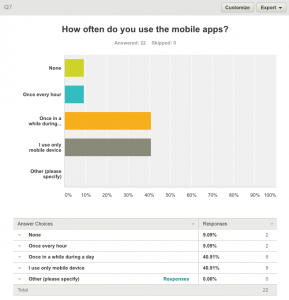
Data suggests that interested users of this app are keen users of mobile devices for information seeking, either solely user a mobile smart phone (40.91%) or using one at least daily (40.91%).

This data supports our decision to focus development of our app for the mobile smart phone market initially.


Question 8. Why do you choose the internet to help you pick travel destinations?

survey Q8

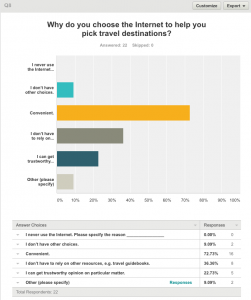
Data suggests that interested users of this app use the internet to help choose travel destinations because it is convenient (72.73%) or that they don’t need to rely on other sources (36.36%).

This supports our decision to focus development of our app for the mobile smart phone market initially.


Question 9. Further suggestions.
survey Q9
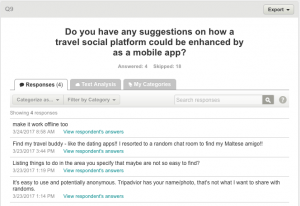
Four of the respondents that were interested users of this app have suggested:

Offline functionality. Which will will include with downloadable maps and guides.

Find a buddy – Tinder style function. Which we will include with the connection feature.

Area specific things to do. Which we will include on our downloadable maps.

Anonymous users. This is not something we plan to include, since the social networking aspect relies on users being visible in order to connect.

NaviGap Development Costs

NaviGap Development Costs:

The primary factors that we see as influencing the development costs of NaviGap include:

  1. Monetisation Model
  2. Platform
  3. Functionality
  4. Design
  5. Research
  6. Developer

1.Monetisation Model

It would be easier and more straight forward to create an app that is simply sold for a fixed, upfront price as opposed to one with In-app purchases that will require continuous updating to the software. We have decided on a blend of models that will include in app purchasing therefore long term costs of development need to be factored in.

2. Platform: Android Or Apple

iphone mapIt is possible to build an app that is accessible on a number of devices: iOS (iPhone and iPad), Android, Windows Phone, the Web or one that can be used on all of them. The price of development will vary accordingly. At this stage we are only considering mobile apps however, and therefore our options are either Android or Apple. We have determined that our app is to reach a demographic of 18-25 years olds so JAMR researched which platform would best suit this.

Image from blog.mobiscroll.com.

Each one of the aforementioned platforms requires a particular programming language, different development environments and programming models based on platform-specific APIs. For example, developing applications for Android requires Java, while developing applications for iOS requires Objective-C. It is apparent that, if a company decides to support both Android and iOS platform, there is a constraint to maintain two versions of a single product: one version implemented with Java for Android and a second version implemented using Objective-C for iOS. Mobile cross-platform tools (CPTs) provide an interesting alternative to native development. Cross-platform tools aim at sharing a significant portion of the application codebase between the implementations for the different platforms. This can drastically decrease the development costs of mobile applications. (Willocx ,Vossaert , Naessens, 2016).

JAMR intends to use a CPT to generate an app for both IOS and Android.


3. App Types & Functionality

The technical specifications of the app will be the single biggest factor in its cost. App types down into the following four categories:

  1. Table/List – designed primarily to display a relatively simple collection of information
  2. Database – designed to allow users to find, sort, and display data from data sets
  3. Dynamic – designed to cooperate with other platforms and software via APIs.
  4. Games- designed to be dynamic and have advanced features.

The more complex the functionality, the expensive the corresponding development cost will be. Quotes will need to be solicited from multiple developers, however, JAMR plans to develop the app ‘in house’ using our teams software development skills thus reducing the cost of development.


4. Design:

The design is an important feature of the App, particularly in terms of attracting a user to the initial download since customers are attracted by an icon and/or design. Similarly, design can make them want to use the app more, NY Times 2015.

A compelling design generated from a proven design team with a consumer-tested portfolio, could be very expensive. JAMR need to budget and prioritise based on the young person target audience who potentially are very design sensitive, therefore priority will be given to a high end design.


  1. Market Research:

The traditional questionnaire survey incurs a great human and financial resource. Whereas an online survey system could immensely cut the costs of questionnaire printing and labour in terms of service fees for interviewers, travelling expenses and data entry fees with a fixed cost will be paid that includes questionnaire design fees, network expense and data analysis service fees.

Other advantages of web-based questionnaires are:

  • Automation and real-time access.  Analysis is easier, and available immediately.
  • Convenience.  Respondents can answer questions when they want.
  • No interviewer.  No influence from the interviewer, means less bias.
  • Target PopulationThe sample may prefer just online surveys.

Therefore, a web-based questionnaire could replace the traditional paper questionnaire with minor effects on response rates and lower costs, potential disadvantages being a lack of respondent cooperation in terms of internet uses receiving lot of feedback requests, and the lack of interviewer to clarify respondent queries could mean that data collected is less reliable. (Hohwü, 2013).


6. Developer: Freelancer vs Agency

Different apps vary widely in developmental cost and there are 3 basic categories of developers you can choose from:

  1. Freelancer – affordable option
  2. Small agency – specialists in specific areas
  3. Large agency – big brand guarantees

Clutch surveyed representatives from 12 leading mobile application development companies to determine cost ranges of building an iPhone app and the key variables of cost and found that the median cost  range is between $37,913 and $171,450, but could be as much as $500,000.

NaviGap however will be using JAMR’s ‘in house’ software developer on this project.


Hohwü, L., Lyshol, H., Gissler, M., Jonsson, S. H., Petzold, M., & Obel, C. (2013). Web-Based Versus Traditional Paper Questionnaires: A Mixed-Mode Survey With a Nordic Perspective. Journal of Medical Internet Research15(8), e173. http://doi.org/10.2196/jmir.2595