
Our team in the University of Southampton Libraries, in collaboration with the Web Science Institute, arranged an afternoon of talks from the Library of Congress in July 2019. The talks included some exciting examples of data visualisation and inspired us to think how we could open up our own library data in the form of a competition. At the same time one of our colleagues was writing a blog post on Knitting With Meaning for the Winchester School of Art Library blog and came across some lovely examples of data being visualised in a creative or artistic way, for example:
https://wsalibrary.wordpress.com/2019/08/06/knitting-with-meaning/
I have also seen some lovely examples of mood scarves or mood blankets, where the creator chooses colours to correspond to emotions and knits or crochets a row, section or blanket square to correspond with how they are feeling each day over a set time period. A similar concept is the temperature blanket, knitting a row or set of rows each day to coordinate with the outside temperature.
I am absolutely in awe of this sleep blanket, a visualisation of a baby’s sleep pattern over the first year of his life. The sleep data was collected using an app, then exported to CSV, converted to JSON and used for the data visualisation. There is more information on this unique heirloom in this Twitter thread
We wanted to use a dataset that we knew was clean, accurate, did not contain personal data, was relevant to our staff and students and would be easily understood by everyone, whether they have data visualisation expertise or not.
The idea of using Hartley Library entry gate data across an academic year appealed, especially because it tied in nicely with 2019 marking 100 years of Highfield Campus. In May 1919 there were 215 students, rising to approximately 300 by October 1919 (Nash and Sherwood, 2002). We currently have more than 24,500 students enrolled at the University, with 1,436,491 visits to Hartley Library in the academic year 2018-2019.
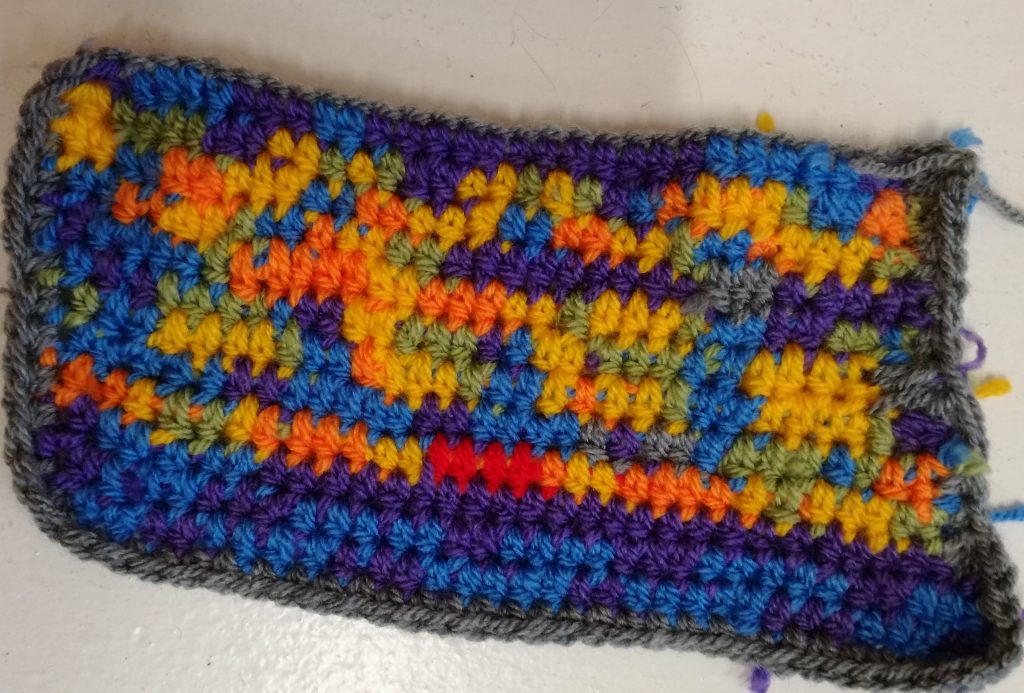
Kate Lapage, from our Institutional Repository (ePrints Soton) team used the data to create a trial crochet piece with the intention of making a bigger piece for the competition:
I am calling this piece A Stitch a Day as each half-double crochet represents one calendar day. September at the top. Each line a calendar month. The colour shows the total number of entries into the library,
· Grey – we were closed
· Purple up to 2000 entries
· Blue 2000-4000 entries
· Green 4000-6000 entries
· Yellow, 6000-8000 entries
· Orange, 8000-10,000 entries
· Red over 10,000 entries.
The piece took a couple of hours to make and really shows how the library is utilised, especially in May when we hit over 10,000 visits in 4 days in May.
The University has a rich history of working with electronic data from early hypertext systems, through linked data services to championing open and big data. As well as research institutes specialising in big data, we have smaller, end user focused services such as the open data service run by iSolutions which takes datasets from across the University and turns them into useful information for you on the web (if want to know where the nearest microwave on campus is to you, check out data.soton.ac.uk). The Library has been working with research datasets for over a decade, starting with the Institutional Data Management Blueprint (IDMB) and Datapool, both Jisc-funded projects. We have supported researchers to plan, manage and archive their data but we want to do more to help researchers exploit their data and make it more discoverable, reusable and valuable to other potential users.
If you would like to find out more about what we do (from helping write Data Management Plans to issuing DOIs as persistent links to your datasets to advising on sharing your data) have a look at our webpages.
If you would like to find out more about the data visualisation competition please see our Love Data page – the competition closes 24th January 2020 and the entries (physical and digital) will be displayed in the University of Southampton Libraries during Love Data week in February. We look forward to seeing your entries!