 Wingsuits in the past have followed the design pattern “sew, jump, observe” without much scientific research. For us to determine how to create & optimize a high performance, long distance flying suit we are using computational fluid dynamics [CFD] to determine the areas on the wingsuit which effect the lift & drag production drastically. CFD lets us generate beautiful images which helps us to visualise how the flow moves around the wingsuit! We will not only address the wing design, but how the head, hands & feet affect the flow, allowing us to introduce solutions for these problem areas.
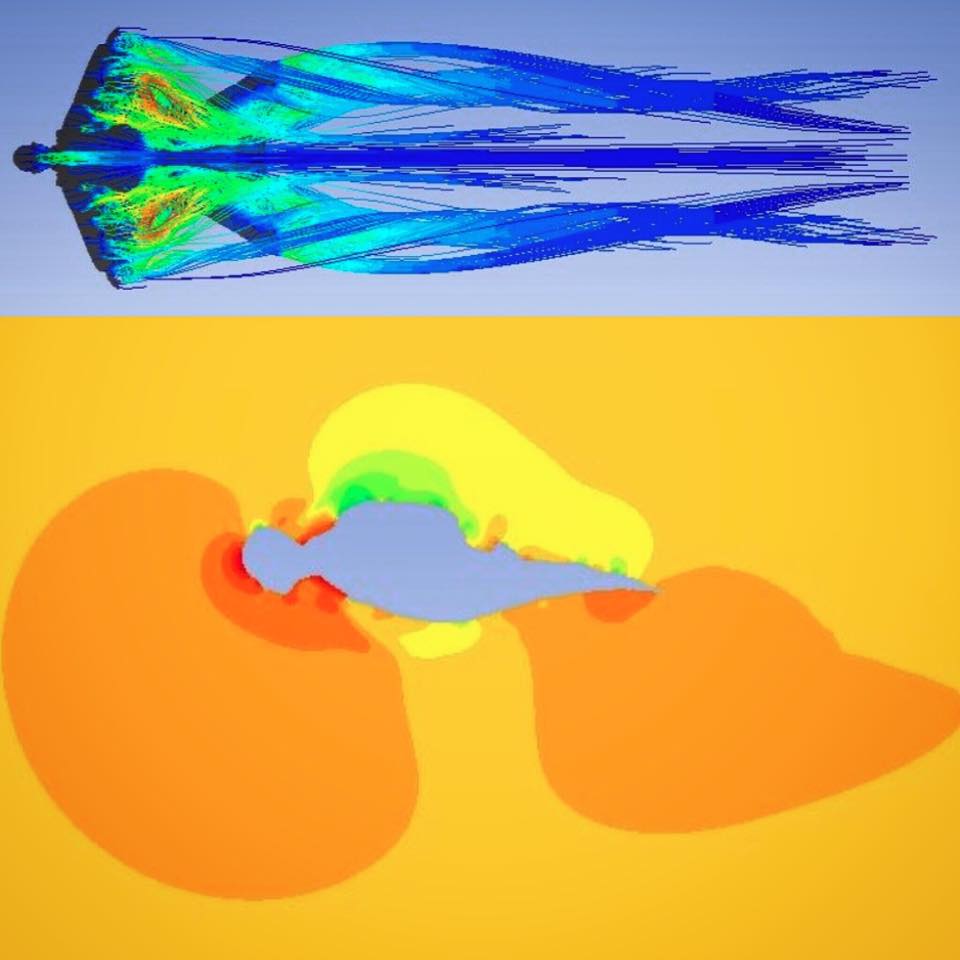 Top: Turbulent kinetic energy [TKE] particle tracks – red lines represent high energy, dark blue lines show low energy tracks. The dark blue line running (left to right) from the head, over the back extending beyond the feet of the wingsuit shows a turbulent stream of air. Bottom: Pressure distribution – red shows high pressure regions, green shows low pressure. The red high pressure region just above the neck also indicates turbulent airflow. Turbulent flow like this causes the airflow to separate away from the surface of the suit, causing a “messy” region, which produces a lot of drag. Designing a solution for this is one of our top priorities!
We have been working through various CFD design ideas in order to reduce drag and improve the flow over our wingsuit. Keep checking back here and check out our Facebook, Twitter and Instagram for more updates.

No comments yet.