Visualising and Processing TLS Data
The aim of this section is to introduce you to how TLS data is visualised and processed using specialist software. The practical activity provides the opportunity for you to download the software and some real world data to explore a TLS point cloud data set.
Visualising TLS data
TLS normally require bespoke software to operate the equipment, but raw point clouds can be output in a range of formats that can be read by other software such as text files. The Scanstation TLS, that the school of Geography at Southampton has, uses a piece of software called Leica Cyclone to both operate and post-process the TLS and point cloud. The licenses for this software are very expensive but fortunately there is a free viewer available which you will be asked to install and used to explore some sample data in the practical activity below. The actual mechanics of how databases are added to the software and how to navigate around the data are covered in that activity so are not duplicated here.
The figure below shows one of the sample datasets, part of an oil refinery, loaded into a ModelSpace in Cyclone.
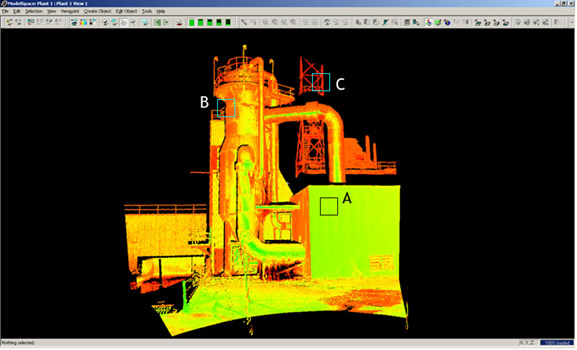
The point cloud above has been coloured by the intensity of the laser returns where green colours are the highest intensity returns and red colours are the lowest intensity returns.
Reflection: Laser Intensity Returns
In the image above explain why returns from area A are intense whereas the returns from B and C are not. There are separate reasons for the variation. Hint: Think about the laser as being similar to a beam of light.
A] Intense because the surface is flat, close and perpendicular to the LiDAR beam
B] less intense because the beam finds less points to be reflected from in this area as the cylinder shape is curving and almost parallel to the LiDAR beam. Its similar to the light intensity if you had shone a torch at the same object in the dark.
C] less intense because its further away so less points make a return – some beams of light are attenuated. Again, this analogous to the dimmer reflection you would see with a torch shining on the frame.
Incorrect
Processing TLS data
One of the issues with TLS is that when we scan an area of interest every single object that is within the scene is returned as a digital point in the point cloud. Often we are only interested in a bare earth model, so this can cause significant amounts of redundant data to be present. One of the key post-processing tasks is to strip out any redundant data from an image. Often this is vegetation and fixed objects such as fences and posts, but instances of people and dogs appearing in scans are not unheard of!
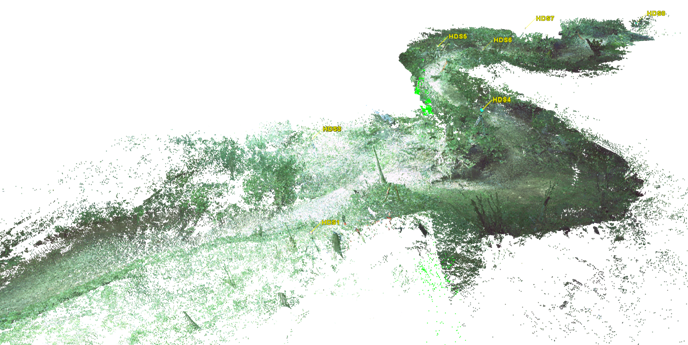
The image below shows a raw point cloud of a ~60m reach of meandering stream in Essex, UK. You can see that there is a lot of noise surrounding the bare earth model, in this case mainly vegetation.
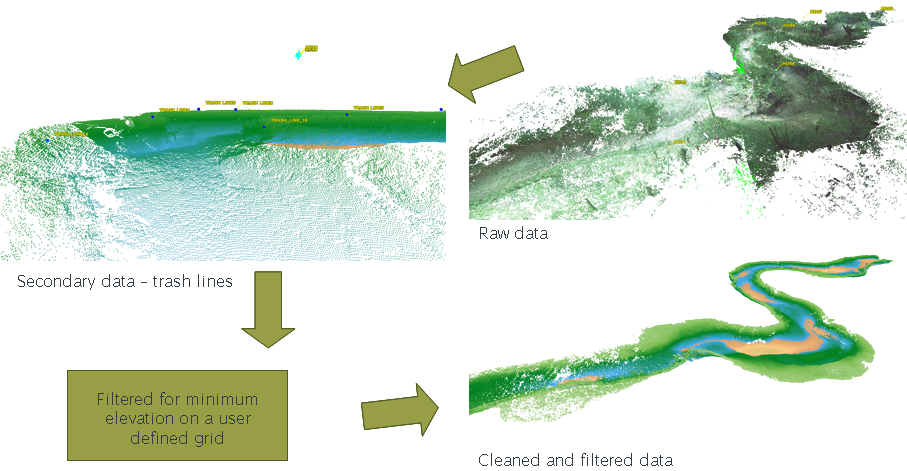
There are a number of ways that we can process this data to try and return a model of just the ground elevations. In the example shown above a number of steps were taken as shown in the figure below.
1] The first step was to manually strip out all of the returns from vegetation that was above the maximum elevation of the top of the stream banks. Because no ground would be above this level we can interpret any other returns as being from vegetation. The banks are not well defined in this stream, so we collected secondary data in the form of trash lines (these are collections of branches and twigs that are left by highest flows in the river). The trash lines were added to the point cloud allowing a clear definition of the bank-full levels in the channel. All data above these levels was deleted.
2] The next step assumes that there is still much noise in the remaining data, in the form of in channel debris and vegetation (the channel was dry when it was scanned). The procedure involves specifying a grid with a square size that is coarser than the scan resolution and then filtering the data so that only the lowest elevation return in the grid is kept and all other points are deleted. This filtering works for a mix of returns with a relatively flat ground level covered by vegetation we want to strip out. It wouldn’t work in a rabbit warren because the ground surface would vary because of the holes.
Applications of the derived point cloud are discussed in the next section.
Practical Activity – Introduction to TLS data visualisation
Download the Leica Practical (caution: large file) which provides a copy of the view only software, some example data and a set of practical instructions. This activity provides you with hands-on experience of loading and viewing TLS data.