Applications of TLS Data
The aim of this section of the unit is to familiarise you with some real world example applications of TLS and the derived data and Digital Elevation Models (DEMs). A number of studies are presented that have been underpinned by TLS data.
Applications of TLS
TLS have been applied to a range of different disciplines and research areas. Any application that requires high resolution topographical data could make use of TLS.
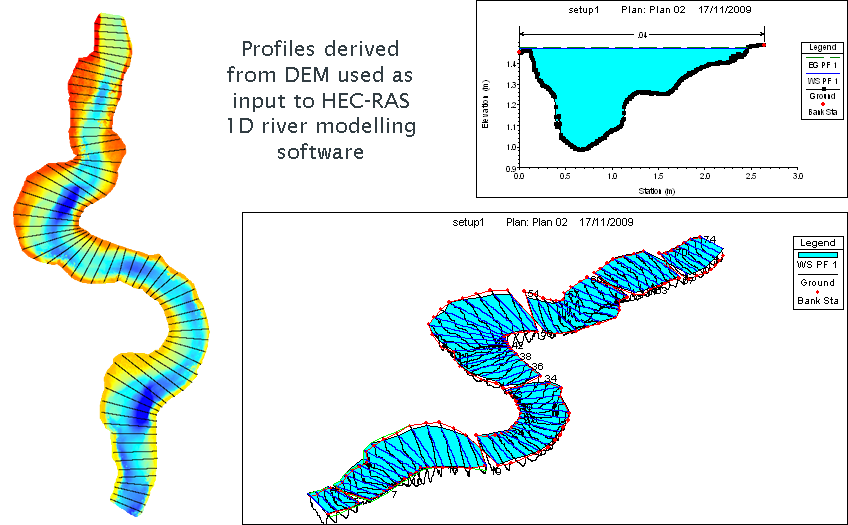
Derivation of stream bed DEMs for hydraulic modelling
The TLS data that was presented in the last section, from a stream bed in Essex, UK, was used to produce a continuous gridded Digital Elevation Model (DEM) of the stream bed. This has since been used to perform hydraulic simulations, exploring the conditions in the stream at full flow. Depth averaged 2D models are currently being used to explore patterns of velocity in the river with the DEM forming the base level in the model. The diagram shows the 2D slices bottom right and velocity of water (blue = fast, red = slow) to the left. Such modelling would be impossible without suitably high resolution DEMs created from scan data.
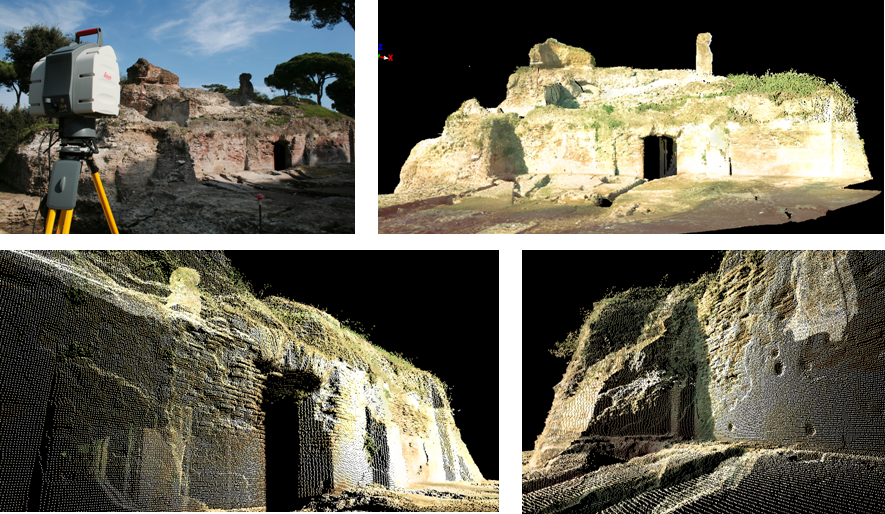
Archaeological modelling/preservation
The Scanstation was used in 2010 to record much of a very important Roman port, known as Portus, which has been uncovered by archaeologists at the University of Southampton. The TLS enabled very high resolution models of the structures to be recorded. These can be analysed back in an office environment and serve as a permanent record of the site as it was when uncovered.
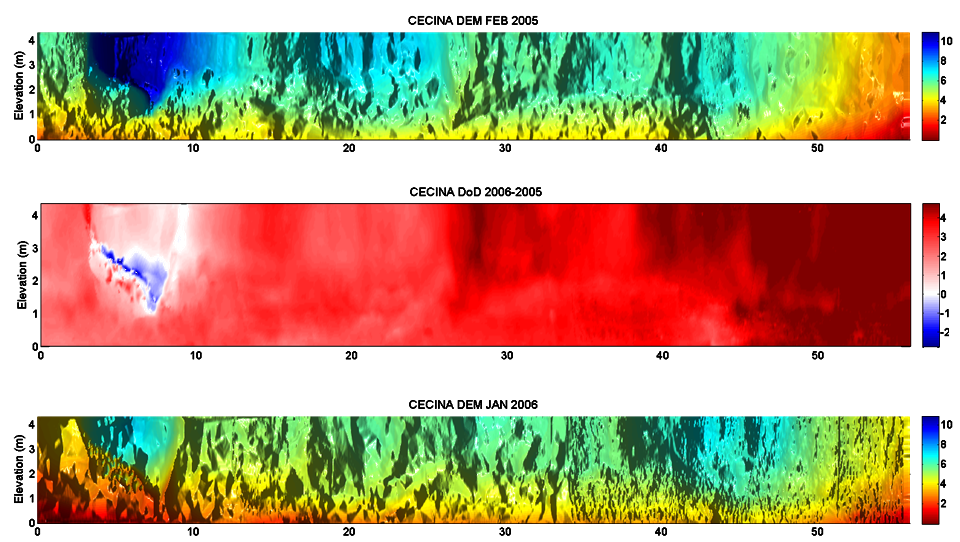
Analysis of patterns of bank erosion
Research on the Cecina River in Italy has been focusing on patterns of river bank erosion. High resolution scans have been taken at the site since 2003 and these have been post-processed in a similar way to the Essex stream bed data to produce bank DEMs which can be used to evaluate the patterns of erosion through time. The image below shows the DEMs from 2005 and 2006 (top and bottom respectively) and in the center the DEM of difference (i.e. 2006 DEM – 2005 DEM). By comparing DEMs of difference (or DoDs as they are sometimes called) we can explore how the spatial distribution of erosion changes through time. This can be related to secondary data such as river discharge to establish links between the two.
Reflection
Using Google Maps (satellite view) inspect the volcanic craters around the town of Volcano in Hawaii. It's the most active volcano in the world – Kilauea. Volcanologists want to predict eruptions and can do this by seeing subtle cm changes in ground height over areas several square kms that indicate volcanic lava is collecting below a volcano ready to erupt. Would TLS be a useful tool in this situation?
It may have some specialist applications but aerial LiDAR is far more applicable because of the scale – TLS is only useful on the scale of 10s of meters and the craters are hundreds of meters to km in scale.
Incorrect
Reflection
Read the Lichti et al. (2005) and Hodge et al. (2009) papers below which highlight some of the key problems that are identified with the use of TLS. Try to summarise the key causes of uncertainty in TLS data.
The authors of both papers cite a number of problems and limitations with using TLS for fine scale topographical analysis. The three key causes of error are:
- Scanner hardware design
- Surface reflectivity
- Imaging geometry
Hodge et al. (2009) also cite the laser footprint size as being a limiting factor in the resolution of DEMs that can be created from TLS data.
There are other issues highlighted, the above represent just a few.
Incorrect
References
Bae KH, Belton D, Lichti DD. 2007. Pre-processing procedures for raw point clouds from terrestrial laser scanners. Journal of Spatial Science 52(2): 65-74.
*Hodge, R., J. Brasington, and K. Richards (2009), In situ characterization of grain-scale fluvial morphology using Terrestrial Laser Scanning, Earth Surf. Process. Landf., 34(7), 954-968, DOI: 10.1002/esp.1780
Kaasalainen S, Hyyppa H, Kukko A, Litkey P, Ahokas E, Hyyppa J, Lehner H, Jaakkola A, Suomalainen J, Akujarvi A, Kaasalainen M, Pyysalo U. 2009. Radiometric Calibration of LIDAR Intensity with Commercially Available Reference Targets. Ieee Transactions on Geoscience and Remote Sensing 47(2): 588-598. doi:10.1109/tgrs.2008.2003351.
Kukko A, Kaasalainen S, Litkey P. 2008. Effect of incidence angle on laser scanner intensity and surface data. Applied Optics 47(7): 986-992.
Lichti DD. 2005. Spectral filtering and classification of terrestrial laser scanner point clouds. Photogrammetric Record 20(111): 218-240.
*Lichti DD, Gordon SJ, Tipdecho T. 2005. Error models and propagation in directly georeferenced terrestrial laser scanner networks. Journal of Surveying Engineering-Asce 131(4): 135-142.