Topographic Data and Their History
The objective of this learning object is to introduce students to the basic concepts of topographic data and the historical development of such data.
What are topographic data?
‘Topography’ is a combination of two Greek words: topos meaning place, and graphien meaning write. Therefore in broad terms ‘Topography’ is the written, or drawn, description of a place.
Topographic maps are generally a two dimensional representation (using only horizontal and vertical position) of three dimensional Earth surface features. In most cases, topographic data comprise all three dimensions that can be attributed to the position of a feature on the ground as location x (longitude) and y (latitude) and z (elevation).
We can represent maps using between one (1D) and four dimensions (4D).
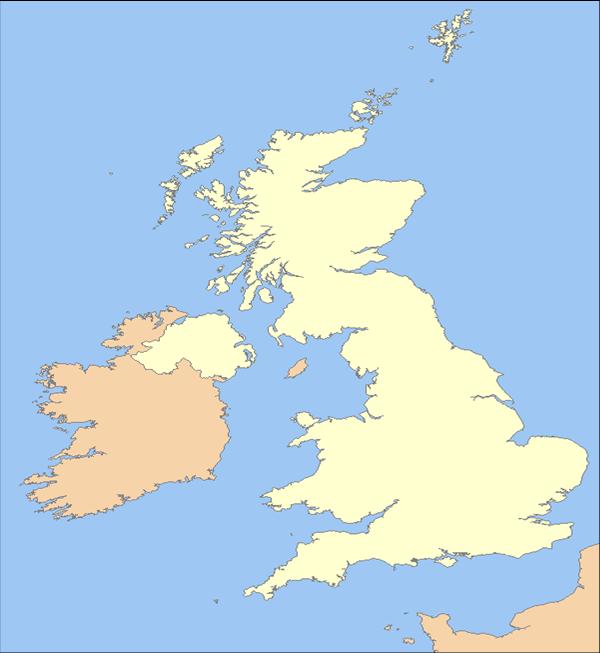
- A 1D map represents a broad overview of an area and can be used to learn the relative position of different places on the ground, compare areas, etc. The figure below represent a 1D map covering the UK, Ireland and Northern France.
- A 2D map on the other hand employs a planimetric representation of elevation information, for example contours on a hill etc.
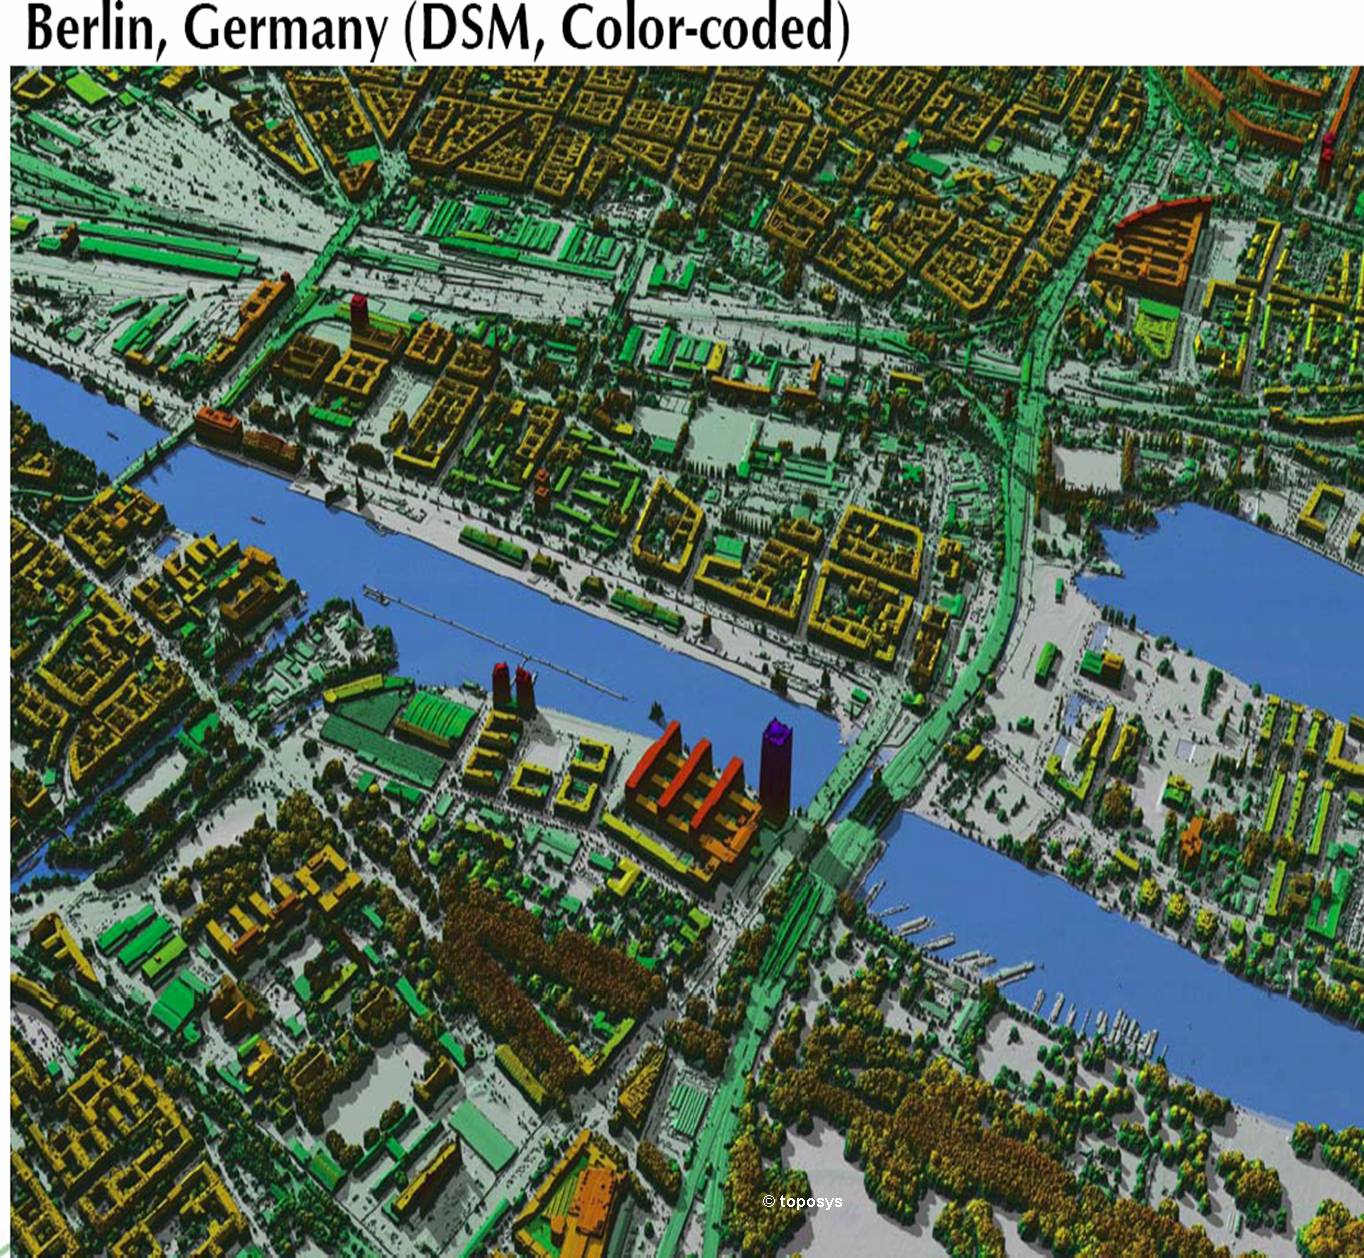
- A 3D map attempts realistic representation of elevation on a 2D map. Here is an example of a 3D map of part of the city of Berlin. Features with higher elevations have been given a red colour whereas features with lower elevations have been given a green colour. This is called a digital surface model (DSM). We will discuss this in detail later in the course.
Activity
Think about any other 3D maps you have come across. Post your experience and some comment on the type of map and application in the discussion forum. Ideally, if the map is available to be viewed on the web, include the link in your discussion post so that the tutor and other students can view it.
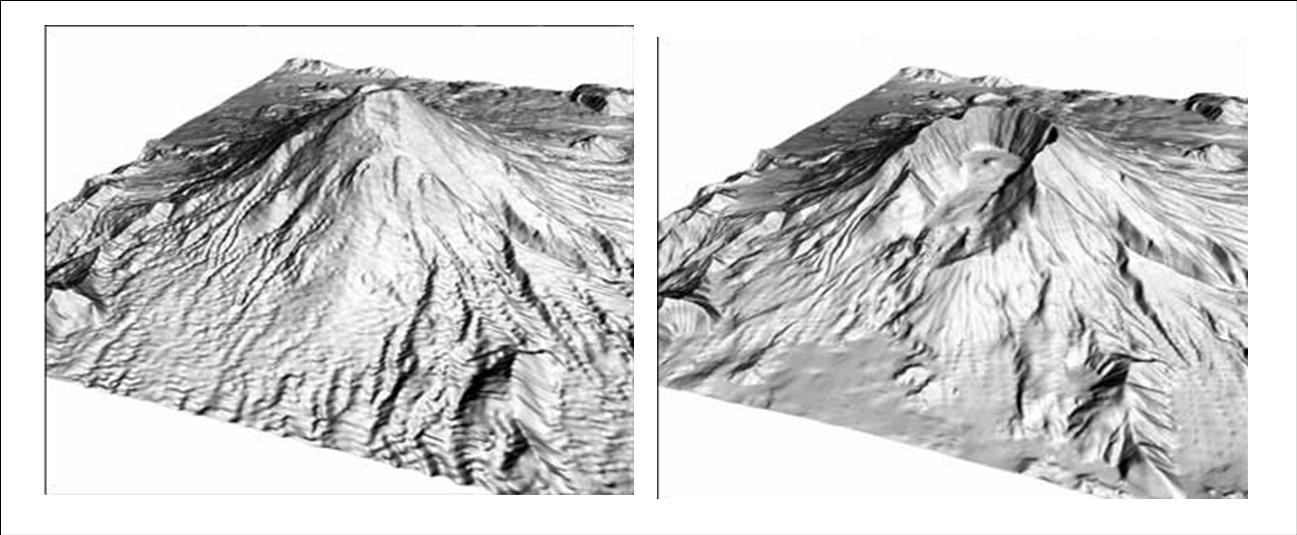
- If we add the time dimension to a 3D map then the representation becomes four dimensional. The example here is an elevation map of Mount St. Helens in two time periods. This was a volcano which erupted during May 1980, the image on the left is before the eruption and the image on the right is after the eruption.
Reflection
Compare these two images. Consider the changes you can observe and how elevation data might be used in this context. When you have some notes of your own, click below for more ideas.
A magnitude 5.1 earthquake triggered the volcanic eruption and covered an area of ~600km2. Elevation data could be used to measure the change in the size and shape of the volcanic crater and also to estimate the area covered by the eruption. The area covered by volcanic ash was smoothed, altering the texture of the land surface, as can be seen to the lower left of the post-eruption image.
Incorrect
History of topographic data
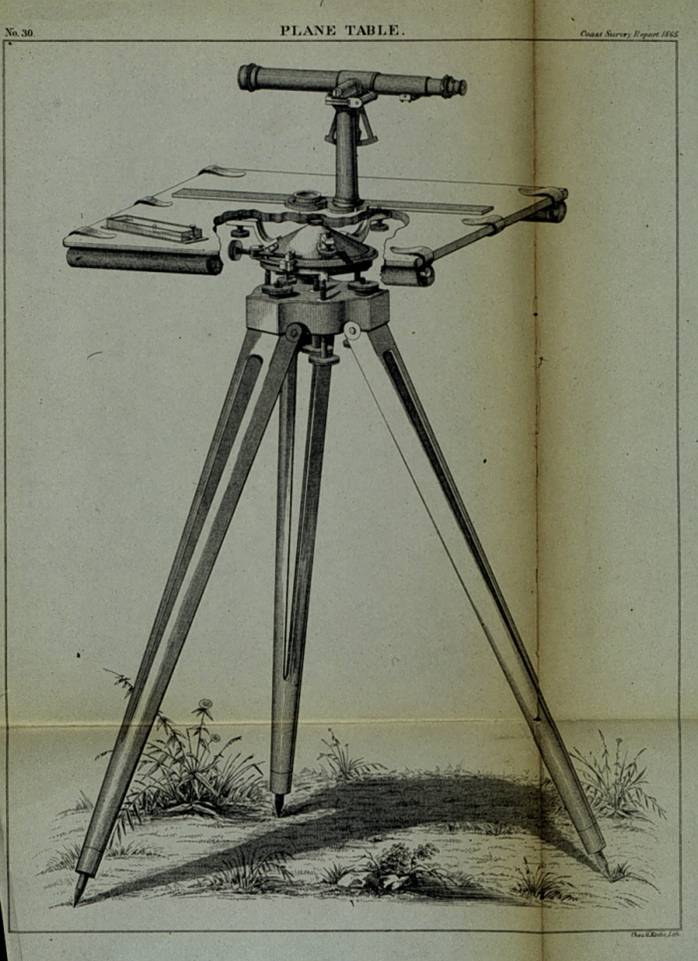
Probably the first mapping technique to cover the vast majority of the Earth’s surface was plane table mapping. A plane table is simply a drawing board mounted on a tripod. This table is placed on a station from which most mapping objects can be seen, then using a sighting device, such as a small telescope, direction lines were recorded on paper mounted on the table. Distances might be estimated or directly measured in the field. With the table horizontally levelled, and angles being read from the sighting device, relative elevations of objects could be recorded. Advances in photographic techniques and the availability of aircraft led on to aerial photography. The chronology of advances in topographic data can be summarised as:
- Plane table photogrammetry ( 1850-1900)
- Analog photogrammetry (1900-1960) (use of photographs)
- Analytical photogrammetry (1960-present) (semi-automated using analytical plotter)
- Digital photogrammetry (from 1990s)
Activity
Refer back to the following article for an account of the historical development of photogrammetry.
Konecny, G., 1985. The International Society for Photogrammetry and Remote Sensing – 75 Years Old, or 75Years Young, Keynote Address, Photogrammetric Engineering and Remote Sensing, 51(7), pp 919-933.
The Topography/Mapping the Shoreline Collection of the NOAA photolibrary contains many images related to plane table mapping and earlier photogrammetry. Visit the website to see some rare images of historical mapping: https://photolib.noaa.gov/Collections/Coast-Geodetic-Survey/Geodesy/Topography-Mapping-the-Shoreline