Application of Topographic Data
The objective of this learning object is to introduce the range of potential applications of topographic data.
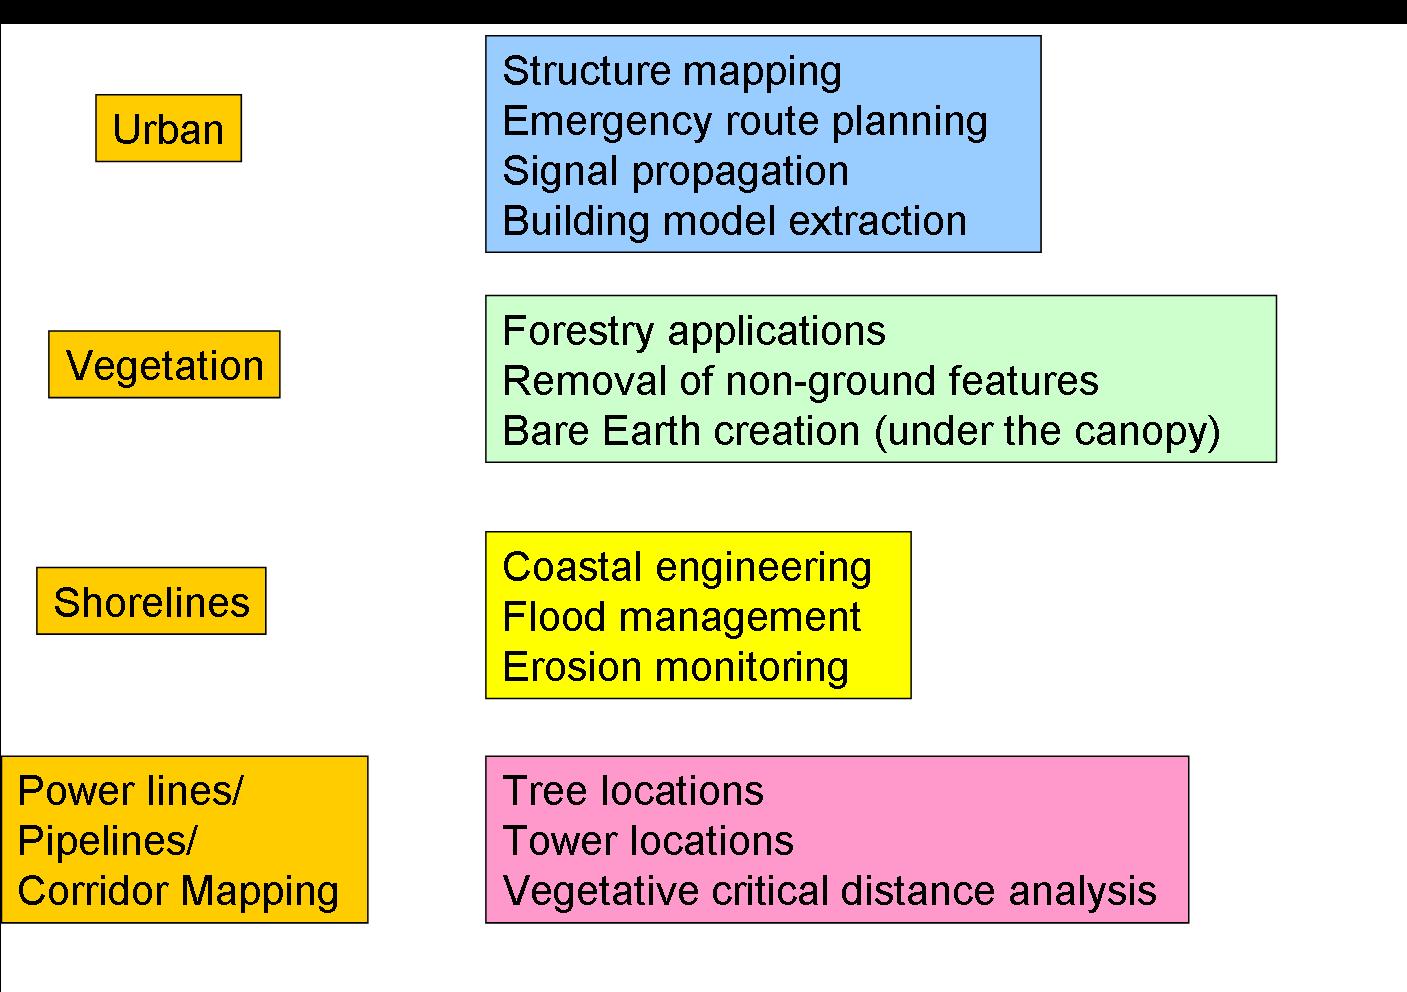
Remotely sensed elevation data has become one of the major components in many geospatial applications. One of the major uses of these data is obtaining the digital elevation model of a specific area with greater accuracy. While most of the applications are local scale, advances in sensor and data processing technologies mean that we can now have data at global scale. The figure below summarises some key areas of application. In urban areas these are mainly used to extract structural information such as building height and mapping structures such as bridges. In recent years there has been increasing use of elevation data in disaster management, particularly planning for emergency routes and damage assessment. In forestry, elevation data, in particular Lidar, are being used to derive quantitative forest parameters such as tree height, density, etc. In the following section we will cover some of these applications in greater detail.
Use as Elevation
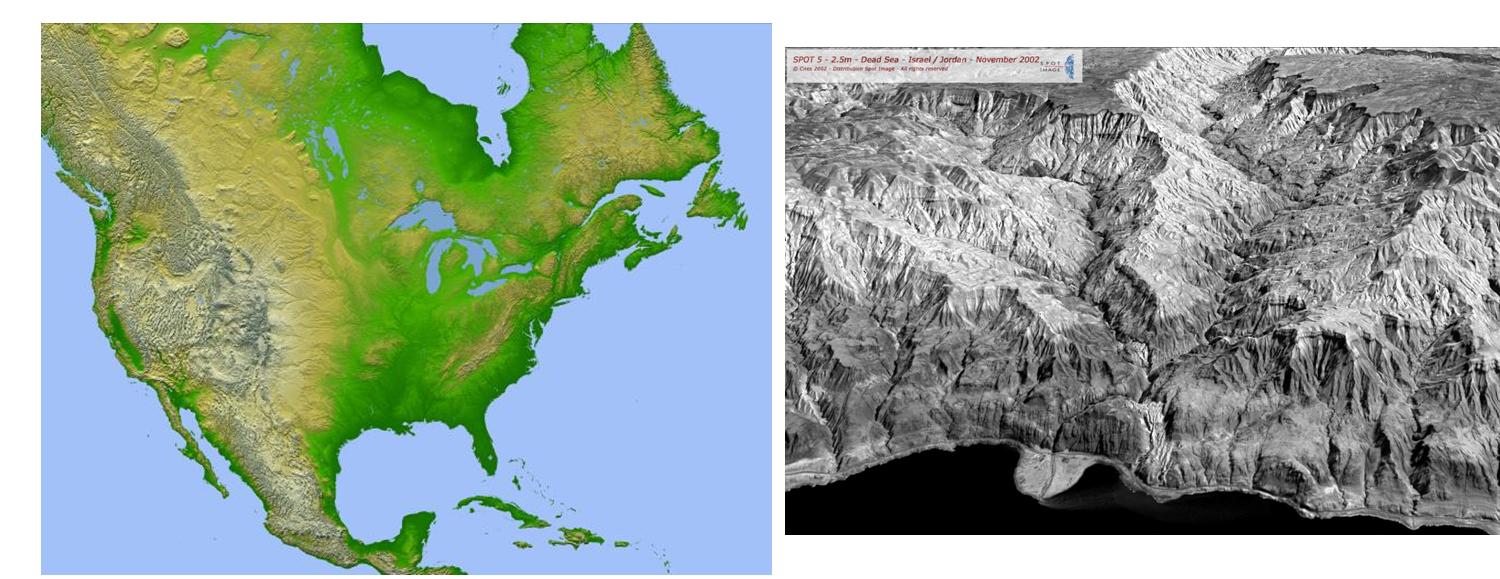
Probably one of the best uses of elevation data is as representation of topographic features either in the form of a 3D visualisation or as shaded relief. The figure below left shows a relief map the US, whereas that on the right is a detailed representation of terrain features.
Slope, Aspect, profile
Slope and aspect (orientation of the land surface), derived from gridded elevation data, can be used in agricultural planning, land subsidence and site assessment studies for specific construction projects. For example, slope and aspect are critical in the assessment of terrain for suitability for energy generation – both wind and solar. In addition, elevation profiles along the a transect in ground are useful for planning pipelines and drainage system.
Orthorectification
Satellite images incorporate terrain distortions when the sensor is not pointing directly vertically (nadir). Changes in the angle of view change the relative size and distance between features in the image. In order to correct this distortion, we carry out a process called ortho rectification (covered in greater detail in another learning object) using a digital terrain model.
Reflection
By considering these two images, can you identify which one has been obtained at nadir? Can you see any difference between the two images? Is there a change between approximate distance between features in these images?
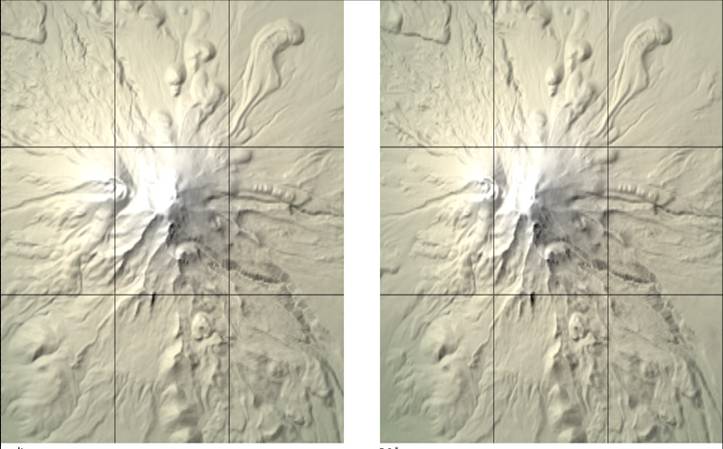
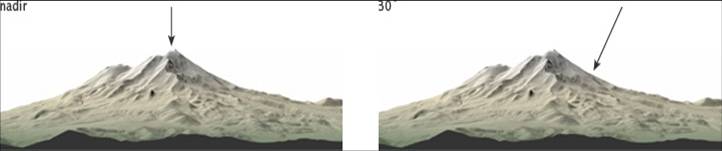
Compared to a nadir view (looking straight down) (left image), a view from the side (30°) (right image) distorts the terrain. Therefore we need to perform ortho rectification if we want to detect changes in the landscape over time or want to compare two images. If you look carefully, objects in the right image appear closer.
Incorrect
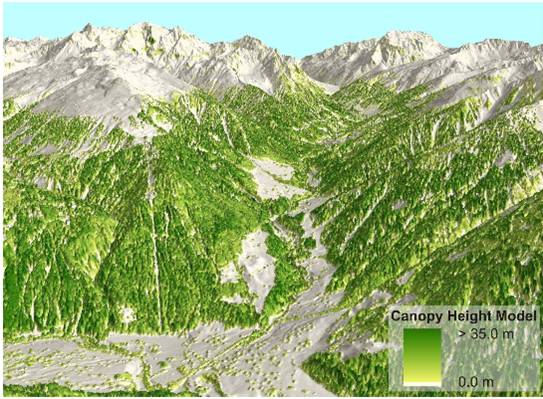
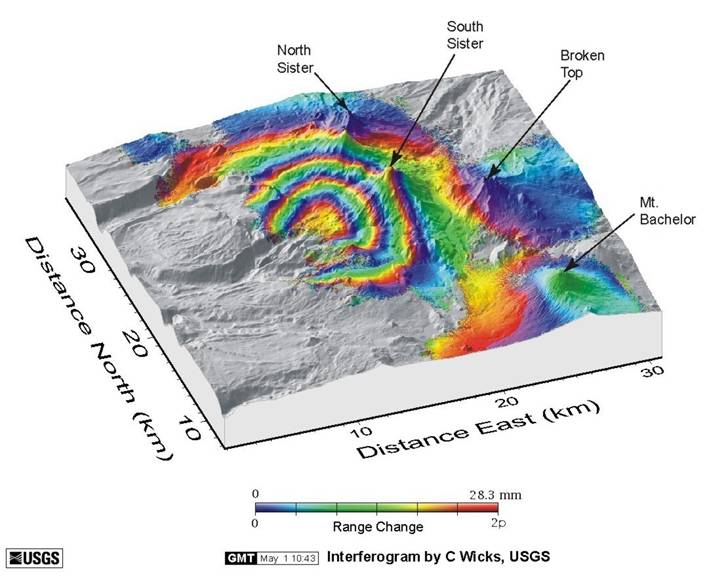
Difference in elevation
We can use elevation data to estimate the volume of any quantity. The example below shows canopy height estimated from the difference between two sets of elevation data, one corresponding to the ground points and other corresponding to the elevation of tree tops. The other example shows the ground movement of Three Sisters Volcanoes, Oregon, USA. This information was derived by using multiple elevation models of the volcano through time and then mapping the difference in elevation over time reveals the ground movement.