Overview of LiDAR Application in Urban Areas
The objective of this learning object is to provide an introduction to the use of LiDAR data in urban areas.
Topographic information is a key input to wide ranging applications in an urban environment, particularly engineering projects, urban and transportation planning, corridor mapping (e.g. roads and telecommunications), mapping risks from natural disasters (e.g. flooding) and damage assessment after a disaster (e.g. earthquake). Mapping topographic structures such as building and roads has always been one of the important applications of remote sensing data. With considerable demand for the generation of 3D city models requiring automation, this task has gained considerable importance in recent years.
Corridor mapping
Corridor mapping is an important task in the transportation and telecommunications industries for designating right-of-ways, pipelines and railway tracks, evaluating clearance for roads and power lines, identifying tower locations, and performing highway analysis. Traditional elevation data either lack resolution or are very expensive due to time-consuming and labour-intensive methods of data collection that require a high level of precision for such projects.
Airborne laser scanners mounted on fixed wing aircraft or helicopters are being used for corridor mapping. However, helicopters are preferred over fixed wing aircraft as they can more easily follow the power line or pipeline and thus reduce the amount of data collected. Most of the time other data such as digital colour photographs are acquired along with the LiDAR data to provide information on:
- Power line heights or sag under different loads
- Inventory
- Tower Placement
- Height of underlying vegetation
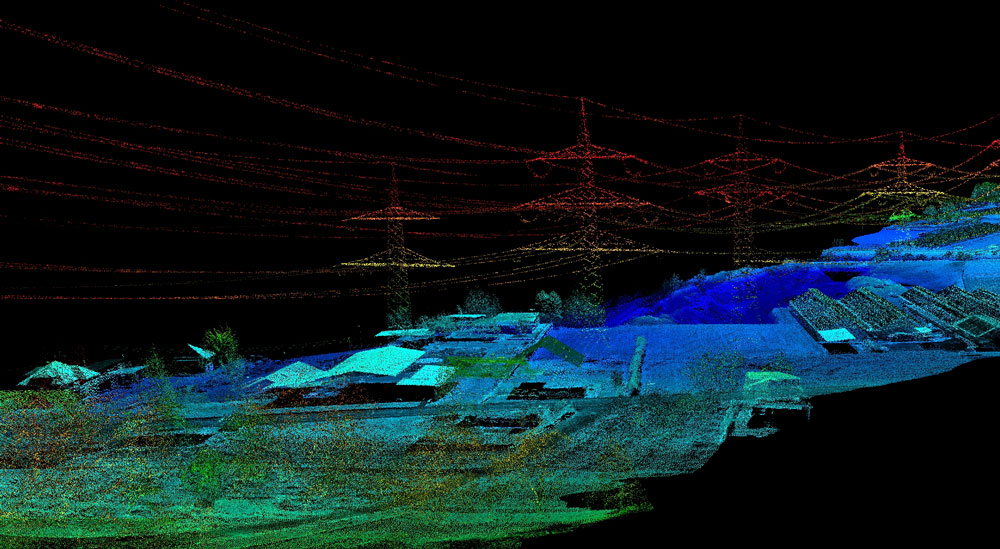
The figure below shows a LiDAR derived power line corridor (© TopoSys, Germany).
Application related to urban topographic object
Over the last decade there has been considerable progress in extracting buildings from LiDAR data and the technology is being used in many part of the world as an operational service. As we know, the main use of this information is in urban planning and management, but here we will cover two slightly different (potential future) applications which are derived from the buildings extracted from the LiDAR data, thus providing so called ‘value-added information’.
Solar potential in a city
There is a rising interest in finding suitable roof areas for installation of solar systems for cost effective sustainable energy production. First the rooftop of individual buildings can be detected and then their slope and aspect calculated to estimate photovoltaic potential. Once these are estimated, then total solar energy received by a roof is calculated by determining the percentage of roof receiving direct sunlight and diffuse sunlight. See Jochem et al. (2009) for further details.
Quite recently, more than one million buildings in New York city were evaluated for their solar potential using Airborne LiDAR data. Overall, 66.4% of the city’s buildings were found suitable for installing rooftop solar panels (http://nycsolarmap.com/).
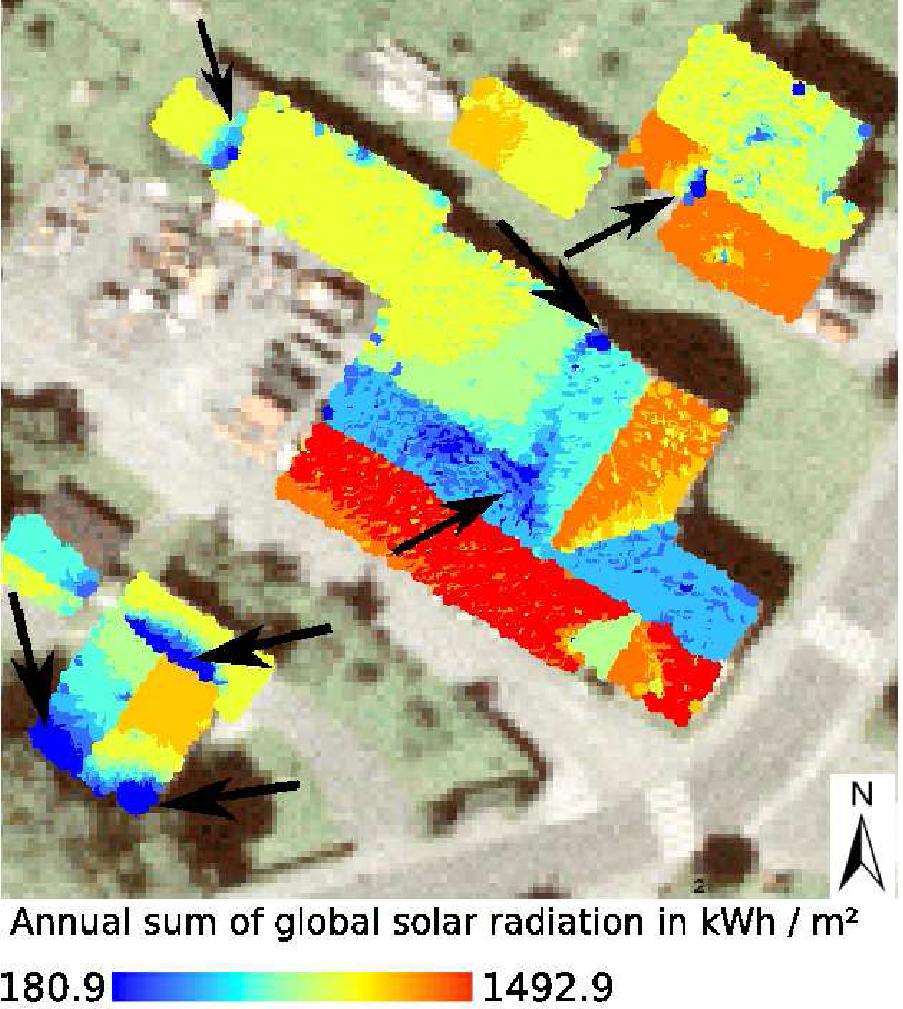
The figure below shows the annual sum of global radiation on roof planes that are affected by shadows of nearby objects. Arrows indicate parts which are strongly influenced by shadows (source: Jochem et al., 2009).
Carbon footprint
Once buildings are extracted from the scene, further analysis techniques allow estimation of volume and floor area in order to derive carbon footprint values. In addition to this, information on vegetation in an urban area such as vegetation type and cover can provide measurable comparative figures between carbon stored in the soil and released into the atmosphere. This combined information on carbon can assist future planning and development, while balancing between the need for urban development and protection of the natural environment.
Disaster management
Real time damage models after a disaster have multiple uses, including those by relief agencies, national and local authorities, insurance companies and construction companies. The number of people affected by any disaster depends on various factors such as the population density of the area, the type of damage caused by the disaster and the extent of damage, the time of the day, etc. Airborne laser scanning data are being increasingly used in post disaster damage assessment, in particular related to earthquakes. After an earthquake the laser scanning data can be used to obtain information by extracting the buildings and other man-made objects and comparing these with the pre-earthquake data.
- The first task after an earthquake is to extract the building model of the area by using the post disaster data and then compare with the pre-earthquake database in order to develop a damage model. It should contain information about the building type, shape and other related information.
- The second important task is to find shortest paths for relief and rescue teams.
- The third task is to find a dumping site and a well connected road for dumping all the destroyed material which may otherwise hinder the rescue operation.
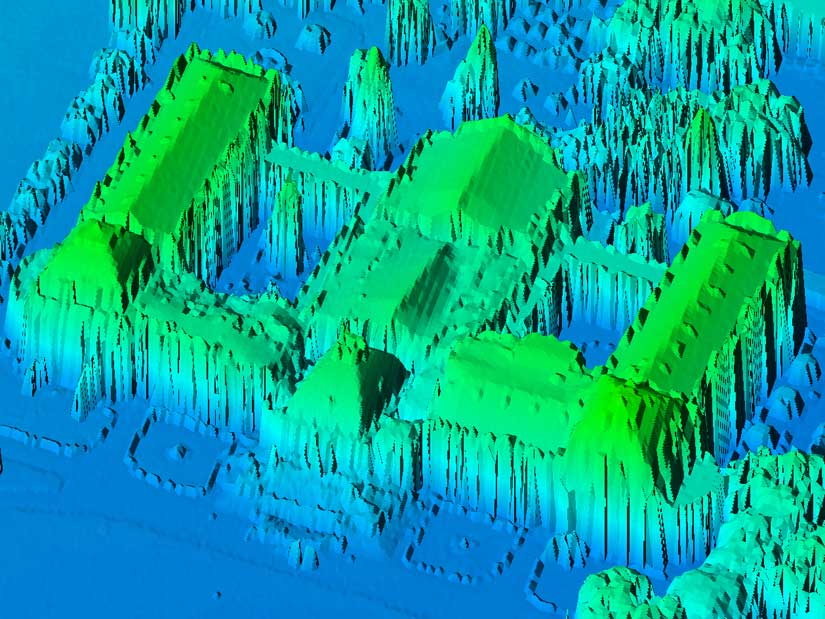
The image below shows LiDAR data of the national palace in Haiti after the 2010 earthquake. Uneven areas on the rooftop were damaged by the earthquake. (Image: RIT, World Bank, and ImageCat (NASA))