Stereoplotters
This learning object introduces stereoplotters, explaining their evolution, operation and role in the automatic generation of data from aerial photos.
A stereoplotter is an analogue instrument which takes two aerial photographs (negatives forming a stereoscopic pair) and positions them in such a way that they produce a stereomodel from which elevation can be recorded and plotted as contour lines on topographic maps. The negatives are used to create diapositives, which are transparent images placed in between glass plates, and these are placed inside two stereoplotter projectors (Lillesand et al., 2008). Light rays are projected through both the left and right images in order to create the stereomodel. An example of mechanical analogue stereo plotter is shown below.
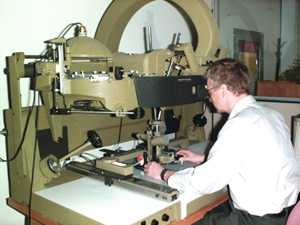
Analogue stereoplotter. Source: NRCAN (2007).
The projectors are rotated and translated along their x, y and z axes to create a similar aircraft-camera-geometry as that which pertained when the negatives were produced in the camera from the two exposure stations. This process creates the correct angular relationships in the stereoplotter and is known as relative orientation. The relative orientation adjustments are illustrated in the animation below. There are 7 adjustment possibilities: 3 translation, 3 rotation, 1 scaling.
In an analogue system, the diapositives are moved mechanically using wheels. However, the technology of stereoplotters has changed dramatically over the years. Analytical stereoplotters use a computer to perform the relative orientation process of aligning the images. This has enabled digital rather than paper outputs. The technology has now evolved to the use of softcopy photogrammetric workstations where both inputs and outputs to the stereomodel are in digital format, which makes the formation of 3D elevation models much easier.
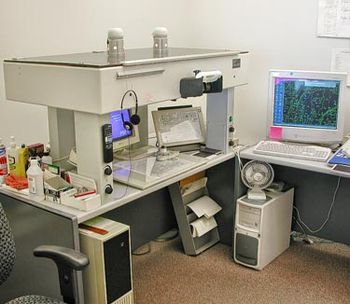
Analytical stereoplotter. Source: USGS (2004).
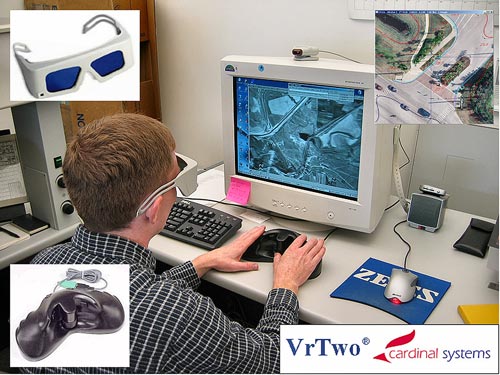
Soft photogrammetric workstation. Source: USGS (2004).
Reading Materials
The following key text and web links provide fuller illustration and explanation of the operation of stereoplotters.
Lillesand, T. M., Kiefer, R. W. and Chapman, J. W. (2008) Remote Sensing and Image Interpretation, John Wiley & Sons, New Jersey.
USGS (2004). Photogrammetry Methods at the Utah Geological Survey: From Field Mapping to Published Map (Images), Digital Mapping Techniques ’04- Workshop Proceedings, http://pubs.usgs.gov/of/2004/1451/brown/