Basic Parameters
This learning object introduces some basic concepts of analytical photogrammetry. It explains the geometry of image acquisition, and issues of overlap between photos in a survey series.
An aerial photograph (either single photo or pair of photos) can be intelligently used to derived quantitative information.
From a single photo we can derive:
- Scale
- Horizontal Distance
- Area Measurement
- Relief Displacement
- Height measurement
Using a pair of photos we can derive:
- Parallax measurement
- Terrain Elevation (in addition to objects height)
- Stereo Model
Reflection
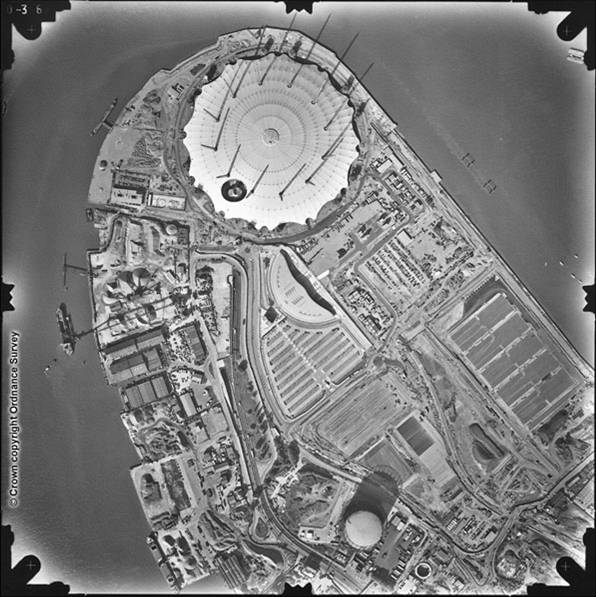
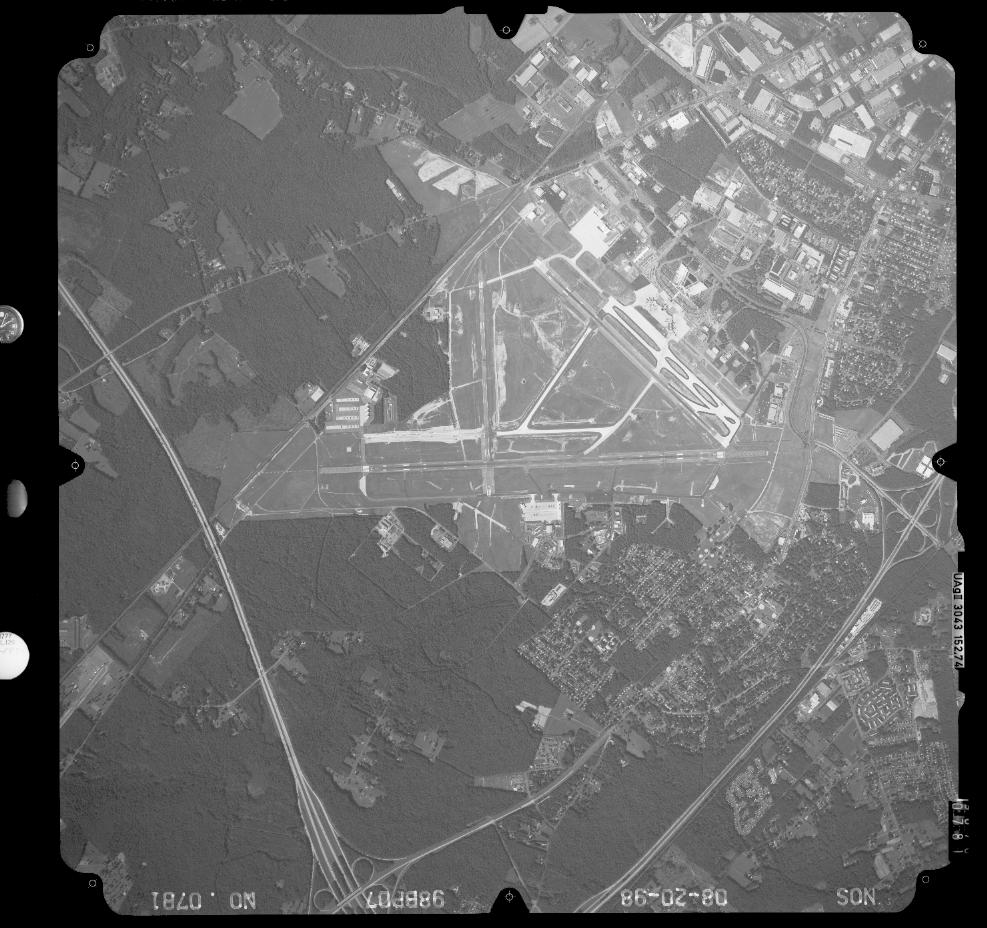
Look carefully at the following two aerial photographs and then answer the questions:
(a)
(b)
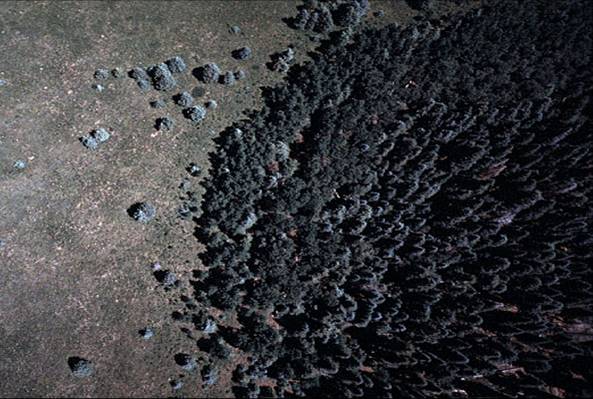
What is the major difference you notice between (a) and (b)?
Which one would be easiest from which to extract quantitative information and why?
What are the interpretation keys which can be identified in both these images?
In (a), one can notice many man-made features and, hence, it is easy to associate ground information to the photo. But in the second photo there is no benchmark association. The image (b) is mainly a natural area and hence it is very difficult to calculate even the scale. So, getting height information from (b) is very difficult. In order to avoid this difficulty we need two aerial photos of the same area taken from different position so as to form a 3D stereo model. We will learn about these issues in later sections.
The major Interpretation keys one can see in (b) are shape and texture. In (a) one can find many interpretation keys such as shape, size, pattern, texture, association, shadow, etc.
Incorrect
Activity
Estimate the scale of image (a) above.
HINT: If you are living in UK then you may easily recognise the features in the image. If you are not from the UK then you can do the following: copy the image (a), paste it in PowerPoint software. Measure some benchmark features (by drawing some line features, and finding the size of those features in Powerpoint). Try to link it to ground size: this will help you estimate the scale. Remember that there is not an exact correct answer to this question because the scale may vary according to the computer screen on which you are viewing the image.
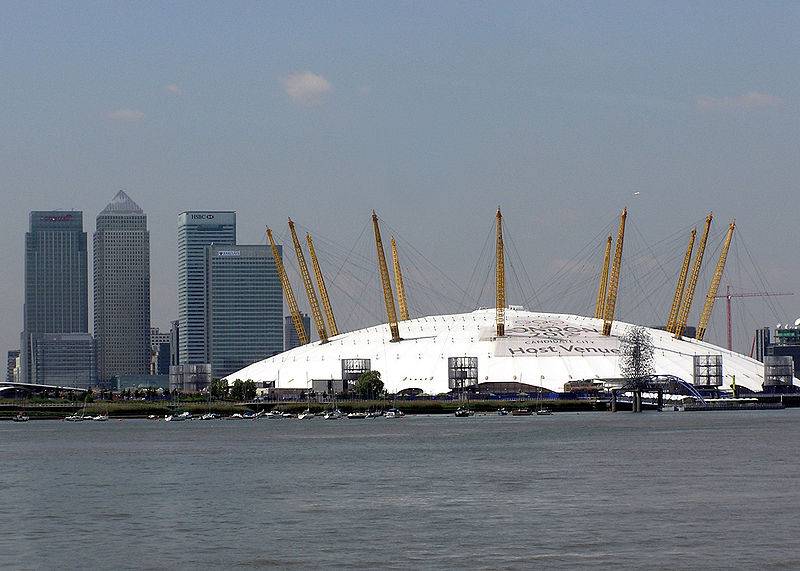
The following feature (The Millennium Dome, now known as the O2 Arena) is in image (a):
Conceptual Orientation
It is important to understand aerial image acquisition system (from ground to camera) in order to be able to infer reliable quantitative information. The following picture helps us with the basic conceptual orientation needed for anlaytical photogrammetry:
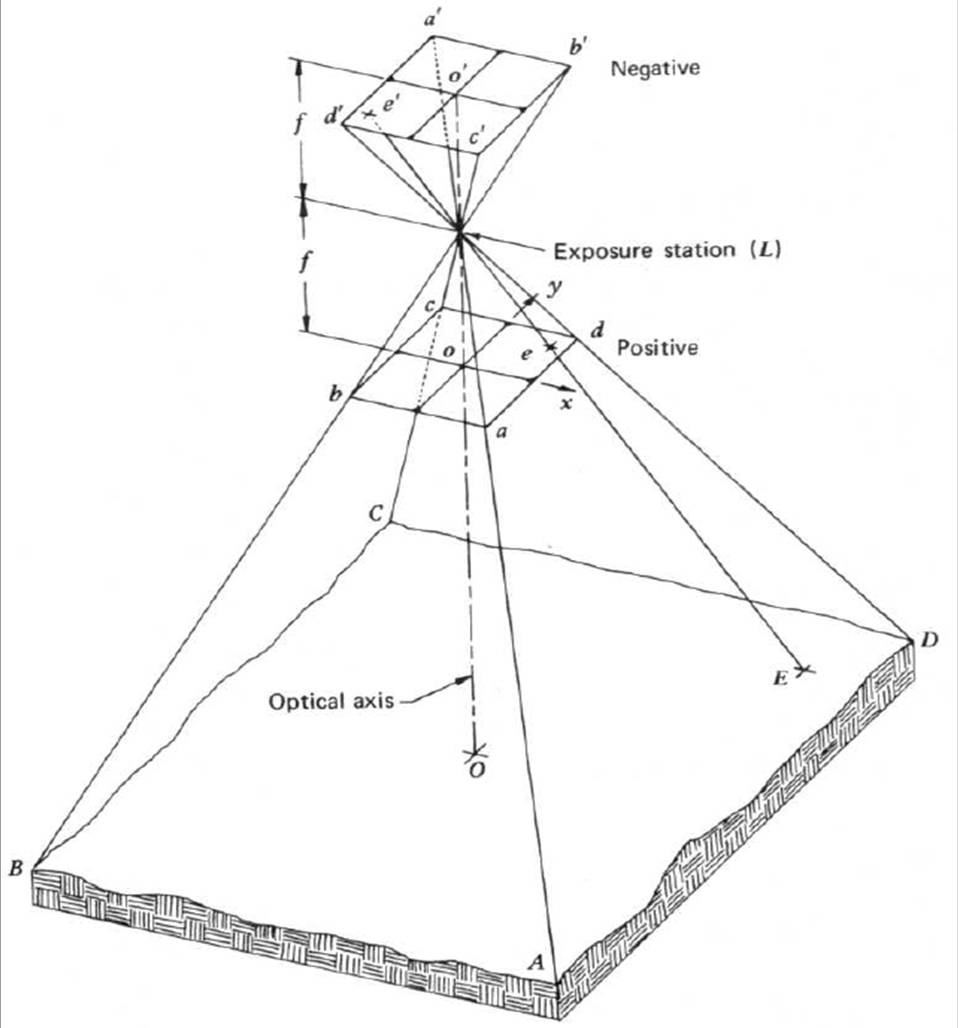
Source: Lillesand, Kiefer and Chipman (2004).
Light rays from the ground (ABCD,E,O) are projected onto the negative plane (a’b’c’d’, e’, o’) after passing through the camera lens i.e. exposure station (L) and positive plane (abcd, o, e). The negative plane is located at a distance f (equal to the focal length) from the lens. The positive plane (the actual image/paper size) is assumed to be of the same size as the negative, as well as being situated at the same distance (f) in front of the lens.
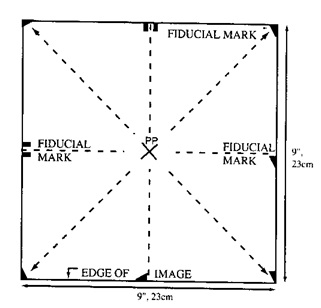
Source: NGS Aeronautical Survey Program Photo Gallery.
As can be seen in the figures above, fiducial marks are equivalent points on the opposite sides of a photo. Fiducial marks are usually the vertices of the photo or the midpoint of each side of the photo. Lines are normally drawn connecting these fiducial marks to define the Principal Point (O). The principal point (O) is the centre point on the ground located exactly below the camera lens. This point in the photo is also called the photo-coordinate origin (o).
The horizontal line across the coordinate origin is the x-axis. The x-axis also refers to the path of the aircraft. It is the convention to orient the photos along the flight line i.e. along the x-direction. In the conceptual figure, one can see that all the points on the ground are projected parallel to the positive plane but reversed on the negative plane as light passes through the lens at the exposure station (L).
Acquisition Concepts
Normally, in an aerial survey, a series of aerial photographs covering the project area is captured continuosly over different flight paths. This block of photos has overlaps between them. There are two types of overlap: endlap and sidelap.
Successive photographs along the line of flight, called the nadir line, have a degree of endlap. Adjacent pairs of overlapping photos are called stereopairs. For stereoscopic viewing, endlap must be at least 50% of each image (normally between 55-65%). With multiple flight lines a degree of sidelap exists between series of images, and it must be approximately 30%. The following pictures depict endlap and sidelap scenarios.
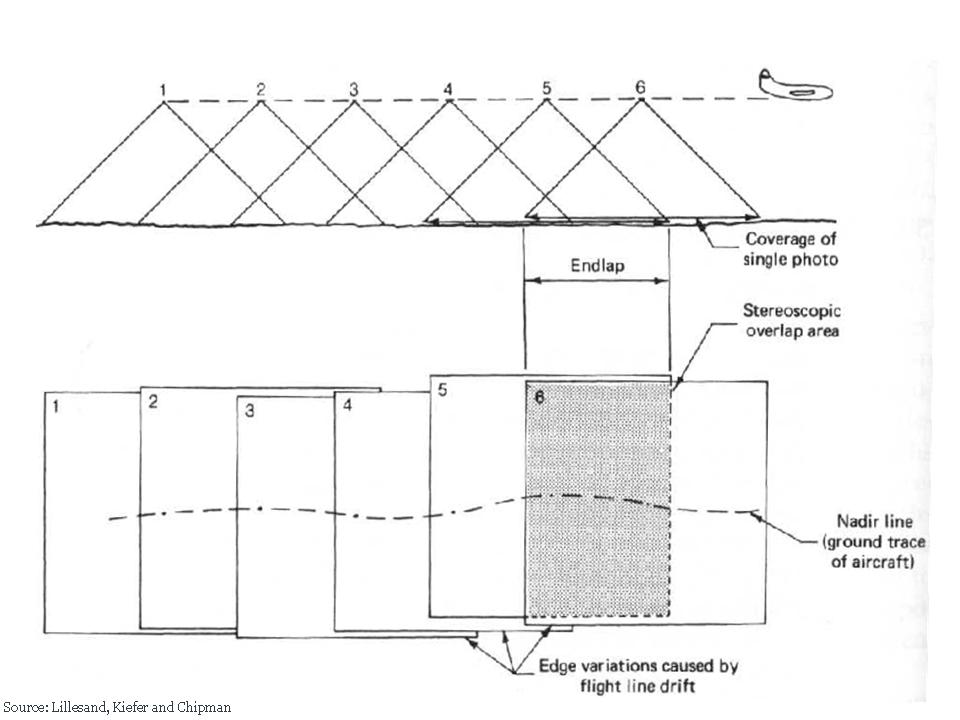
Example of endlap. Source: Lillesand et al. (2008).
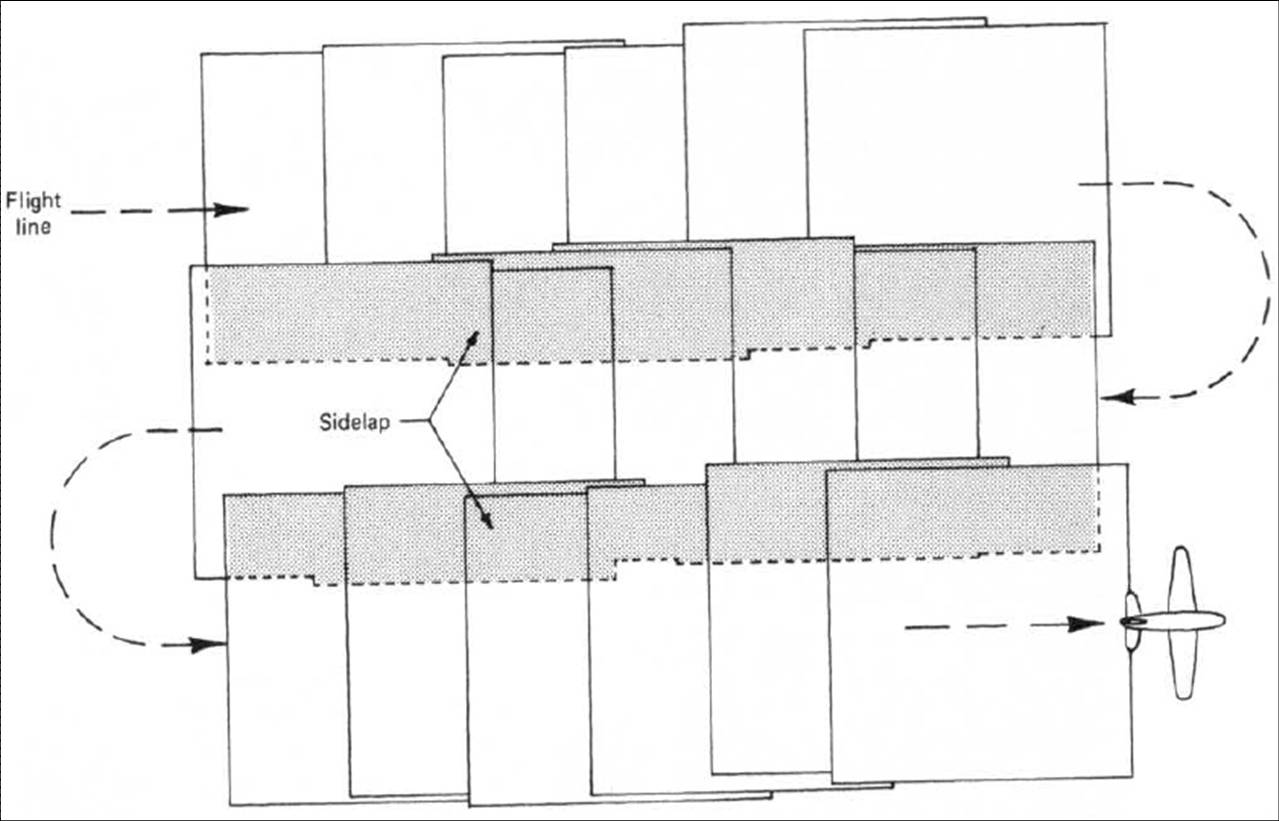
Example of sidelap. Source: Lillesand et al. (2008).
Activity
Calculating endlap
Two successive photographs were taken during an aerial survey. The distance between the centre of exposure of these two photos (called air base) is 4600 feet. The aircraft was flying at a height of 8000 feet and the focal length of the camera was 6 inches (0.5 feet). The size of a photo is 9 inches (0.75 feet). From these measurements, calculate the percentage of overlap between these two photos (endlap).
Hint: Try to find the scale of the photos, then find the size of area exposed in the first photo, then try to link the distance between centres of these photos in terms of overlap.