Extraction of Forest Parameters from Airborne LiDAR Data
In this section we will learn about how various basic tree attributes can be extracted from Airborne LiDAR data.
Extraction of canopy height
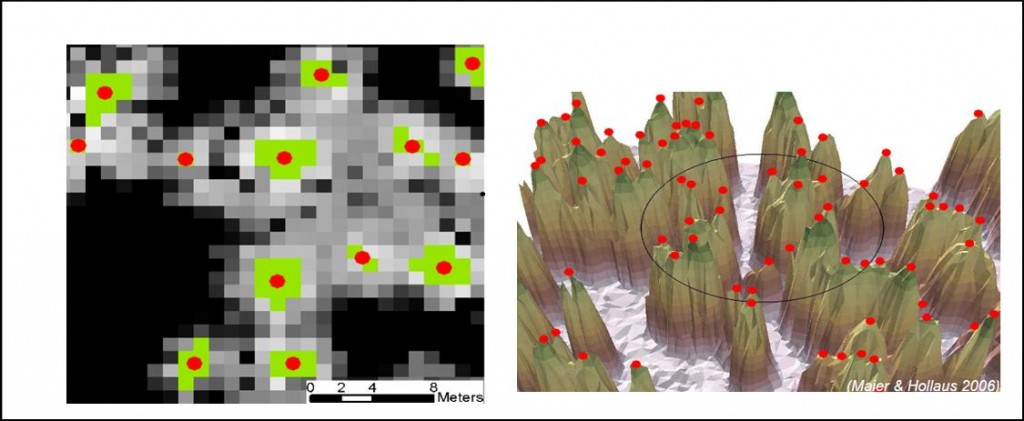
Canopy height can be obtained by subtracting the DTM (corresponding to ground surface) from the DSM corresponding to tree top. This is often called as canopy height model (CHM). The most appropriate way to estimate DSM for this purpose is to select individual tree top by using a local maximum filter and then define the tree crown by segmentation and finally interpolating the missing points by appropriate interpolation techniques. Figure below shows the output from local maximum filter (red points) and its neighbour (green) use for generating DSM.
True-False Question
DTM is generally calculated from first return.
Correct
DSM is typically calculated from the first return and the DTM is from the last return.
Incorrect
DSM is typically calculated from the first return and the DTM is from the last return.
Reflection
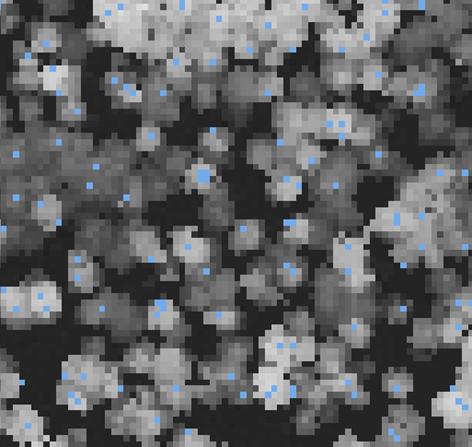
Look carefully at the images below. Image (A) is a first return Lidar raster image, then the image went through some processing steps and resulted in image (C). Bases on what we have covered so far, can you think of the processes involved in getting image C from image A?
First a focal maximum filter was applied with an window size of 10x10. This resulted in an image where all 10x10 pixels were assigned as the same pixel value (maximum in that window). Then image A was subtracted from this image, So the pixels which have the highest value in the 10x10 window had now 0 values (They have same value in A and B) and these are possible individual tree tops.
These canopy heights are generally derived certain caveats that the forest density is not too high and there are no complicating factors such as high slopes, very rough ground or sub-canopies. Even under these circumstances, in which we can identify parts of the signal that come from or near the top of the canopy and ground points, care must be taken in the identification of tree or canopy height. Its not always guaranteed that that a canopy ‘hit’ will come from the very top of a tree given typical LiDAR sampling densities, and returns from tree shoulders will tend to down-bias estimates of canopy height. For such reasons, it is typical to apply some calibration to LiDAR-measured tree heights, particularly from discrete return systems, although other methods such as considering only the upper 10% or so of heights might help alleviate some problems.
Other attributes include calculation of the mean diameter (L) of the derived tree-crown segments (e.g. mean diameter, smallest enclosing circle) based on the tree-crown area (A) as:
Similarly diameters at breast height (1.3 m) dbh can be estimated as a function of Tree height, crown diameter and species.
Canopy Cover
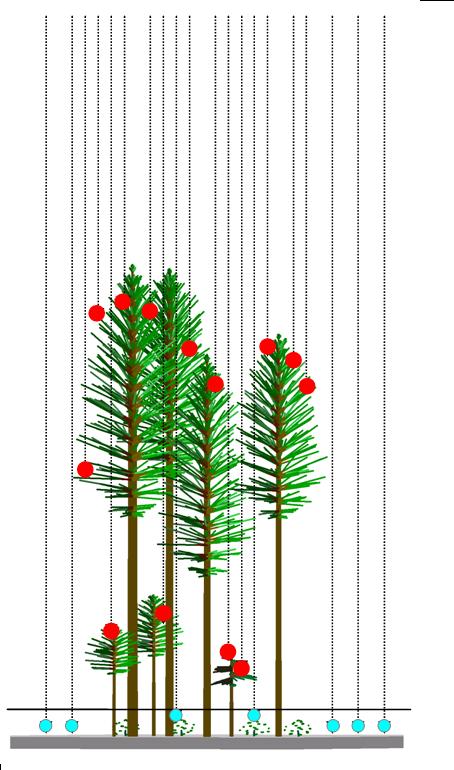
Canopy cover is the area of ground covered by a vertical projection of the canopy. Generally it is estimated at specific grid cell and with in a grid cell the canopy cover is estimated as the ratio of number of first return above a certain threshold (T) (termed as canopy hits) and the total number of first return points (total hits).
Canopy cover (%) = Canopy hits / total hits
In the figure below red points represent the canopy hits whereas the blue points are non-canopy hit points.
Two variables determine the output canopy cover map: height threshold (T) and grid size. To produce meaningful canopy cover estimates, the grid size should be larger than individual tree crowns. With small grid sizes (less than 5 meters), the distribution of cover values of a large area tends to be heavy on values near 0 and 100 because each grid serves to test for the presence or absence of a tree instead of providing a reasonable sample area for assessing vegetation cover.
Reflection
Estimate the canopy cover in the above figure.
% Canopy Cover = Canopy hits / Total hits = 13 / 20 = 65 %


