Satellite vs. Aerial Imagery
The objective of this learning object is to review principal differences between imagery derived from remote sensing satellites and that derived from aerial photography.
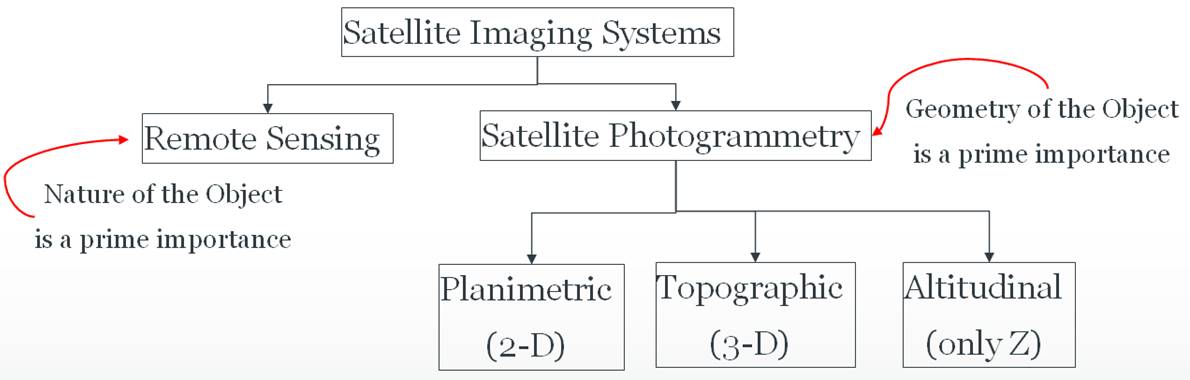
Today, satellite sensor-derived remote sensing (RS) data plays an important and inevitable role in all developmental projects. Utilisation of RS data can be broadly categorised into 2 major groups: thematic imagery and topographic imagery.
Thematic imagery is mainly used to describe/depict the distribution of specific phenomena. For example, vegetation or land cover distribution. The spatial resolution of thematic imagery generally falls in the range 30m to 1000m. On the other hand, topographic imagery is mainly used to depict precise spatial location and height of terrain features, and the spatial resolution lies in the range of a few cm to 10m. Photogrammetric applications require images or photos of very high spatial resolution (at large mapping scale). Hence, in order to differentiate and for easy reference, satellite imaging applications can be categorised into two groups: remote sensing and satellite photogrammetry. The following figure depicts this classification more fully.
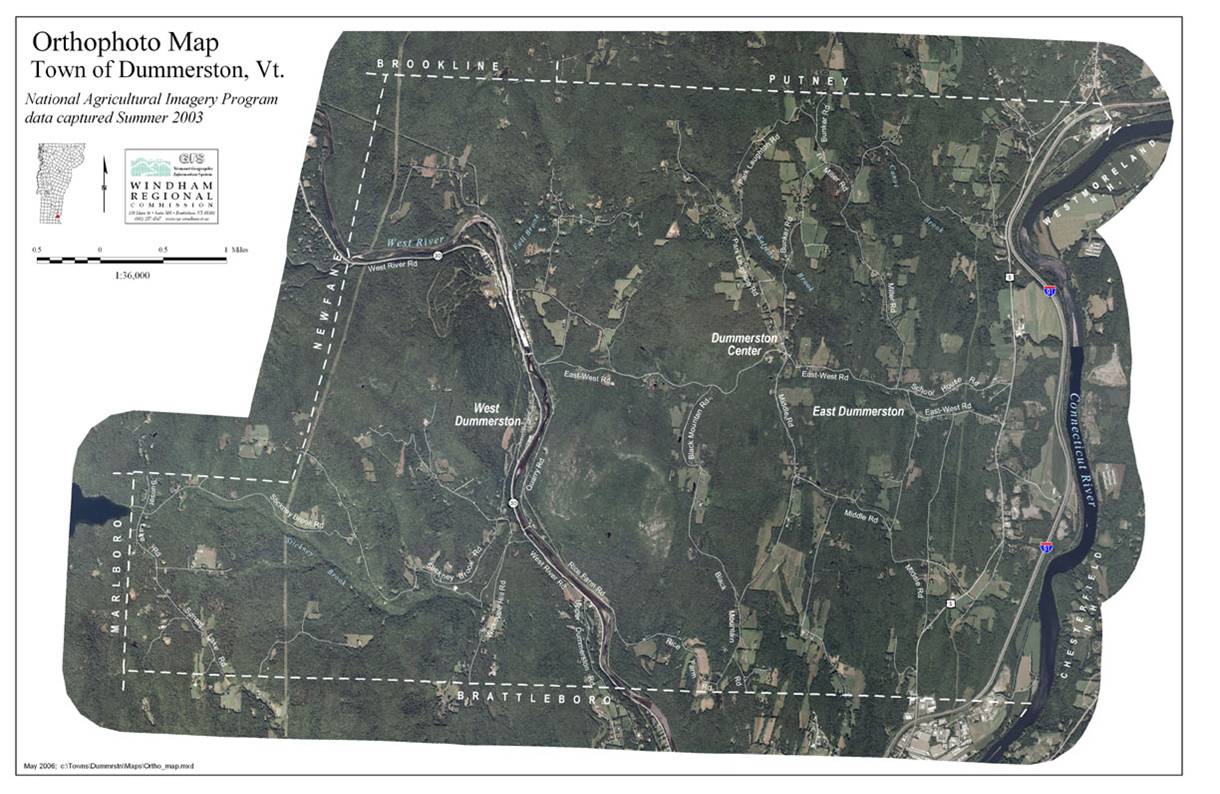
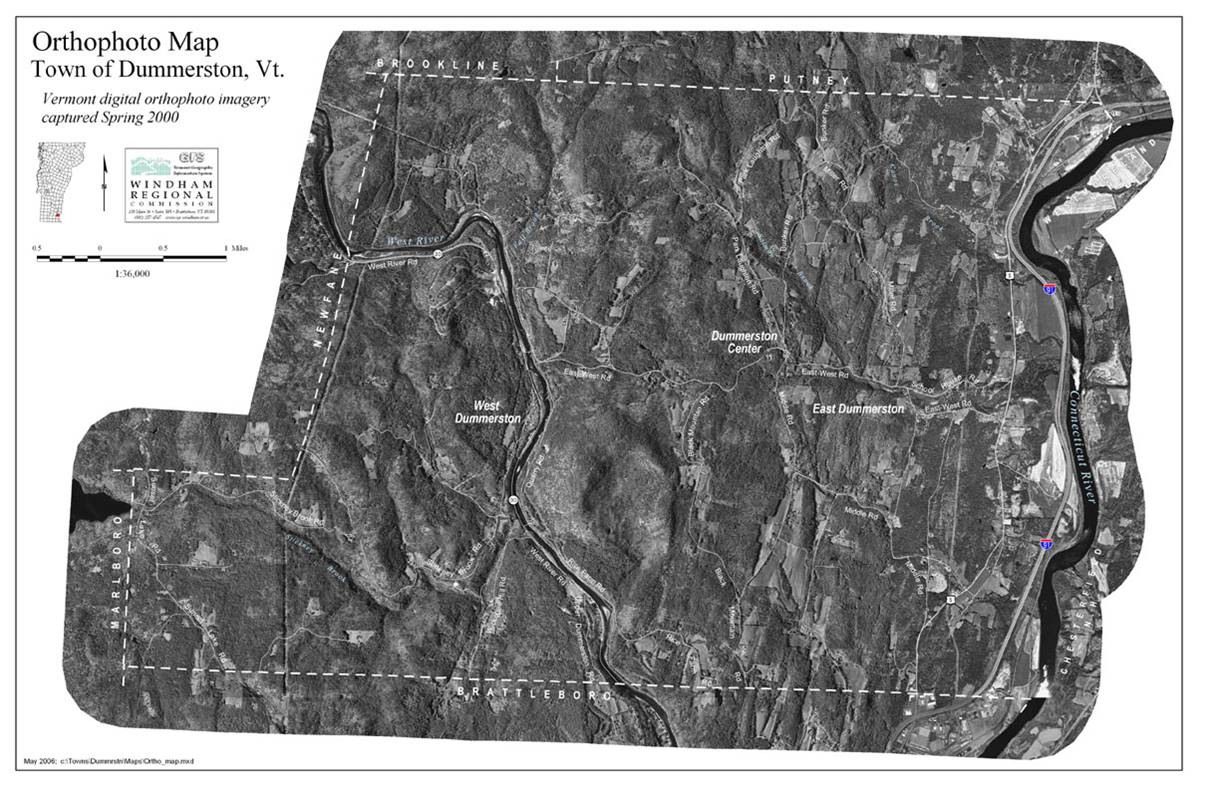
The following figures provide a brief overview of what a satellite-derived orthophoto (a) looks like, and how it differs from an orthophoto derived from an aerial camera (b).
(a) Orthophoto from satellite
(b) Orthophoto from aerial camera
Before exploring satellite photogrammetry in greater depth, it is helpful to review some key differences between aerial photography and satellite Images.
Aerial photos:
- Taken at much lower altitude (few km)
- Large Image Scale (1:10000 or better)
- Small Area Coverage
- Coverage is limited (local and regional)
- Available on demand
- Irregular repeat cycle (i.e., temporal resolution)
- Operational cost is high and varies.
- Imagery is negative/positive; hardcopy format
- Images are captured all at once, frame based
- EM range is visual and infrared
Satellite imagery:
- Taken from high altitudes (few hundred km)
- Smaller image scale (1:50000 or less)
- Field of View is large (FOV)
- Area range from local to global
- Regular repeat cycle
- One time investment in operational cost and is relatively low, and is fixed.
- Imagery is softcopy, digital
- Images are captured using CCD as a linear array, line by line, hence complex geometry
- EM range is visual, infrared, microwave and laser
Reflection
It is necessary to be familiar with some of the basic quantities and relationships, particularly between the altitude of the sensor, scale and resolution.
1. What is the normal flying height of a passenger aeroplane?
2. What is the normal flying height of photogrammetry aircraft?
3. Can you draw a diagram depicting the scale variation with altitude? (assume for example that the focal length of the camera as 152mm)
4. Can you draw a diagram showing the relationship between spatial resolution and scale?
1. Typically 25000 to 27000 feet (Altitudes in civil aviation are generally described in feet). This equates to approximately 8000 to 11000 metres. See http://www.ehow.com/facts_5061375_altitude-plane-flight.html
2. Approximately 6000 feet (2000 metres) - again, check on the web.
3. For calculating scale you need to know the flying height and focal length. f is given, so vary the H and find the scale. Then, plot scale vs. altitude.
4. In the mapping domain, the minimum separable unit is referred to as the thickness of the drawing pen, in other words the finest line one can draw on a map. Generally, 0.25mm is considered as the MSU. In the satellite domain, a pixel is the minimum mapping unit and hence the spatial resolution of the satellite becomes the MSU. If we assume 1m as the spatial resolution then scale = 0.25mm x scale = 1m and hence scale = 1000mm/0.25mm = 1:4000 approximately.
Incorrect
References
Lillisand, T. M., Kiefer, R. W. and Chipman, J. W. (2003) Remote Sensing and Image Interpretation (5th ed.). New York: Wiley. Chapters 2,3.
Jacobsen, K. (2005) High Resolution Satellite Imaging Systems – Overview. https://www.isprs.org/proceedings/XXXVI/1-W3/PDF/038-jacobsen.pdf
Schreier, G. & Dech, S. (2005) High resolution earth observation satellites and services in the next decade – a European perspective. http://dx.doi.org/10.1016/j.actaastro.2005.03.029
Hu, Y., Tao, V., and Croitaru, A. (2004) Understanding the Rational Function Models: methods and Applications. ISPRS XXXV. http://www.isprs.org/proceedings/XXXV/congress/comm4/papers/423.pdf
Eineder, M., Yague-Martinez, N., Minet, C., Fritz, T., and Parizzi, A. (2010) Report on Haiti Earthquake Surface Shift Estimation Using TerraSAR-X Data. Remote Sensing Technology Institute, DLR.