Recent Comments
Archives
Categories
- No categories
Meta
9.1. Vegetation Indices
Objectives
The objectives of this section are to explore the concept of a vegetation index and then look at commonly used vegetation indices discussing their advantages and disadvantages.
Ideal Vegetation Indices (VI)
Ideally a VI should meet the following requirements:
“[the ideal VI] should be particularly sensitive to vegetative covers, insensitive to soil background, little affected by atmospheric effects, environmental effects and solar illumination geometry and sensor viewing conditions”
(Jackson et al., 1983) Emphasis mine.
There are over 50 VIs, we will explain a few of the more common ones; Simple Ratio (SR) and Normalised Difference Vegetation Index (NDVI) are particuarly well known. The Enhanced Vegetation index (EVI) and the MERIS Terrestrial Chlorophyll Index (MTCI) are designed to monitor specific vegetation properties.
N/B: The slides below will not show on the webpage, but you can save/keep them on your computer and view them using the Adobe Flash Player 32 you downloaded earlier
Soil Line and Simple Ratio (SR)
N/B: The slides below will not show on the webpage, but you can save/keep them on your computer and view them using the Adobe Flash Player 32 you downloaded earlier
Simple Ratio Disadvantages
- Any sensor noise that is localised in one band is amplified by the SR
- The ratio can vary from close to zero to much bigger than one. This range creates problems for the choice of displaying data
these problems have led to other ratios being developed.
NDVI (Normalised Difference Vegetation Index)
NDVI = (NIR – Red)/(NIR + Red)
Rouse, J.W., R.H.Haas, J.A.Schell, and D.W.Deering, 1973: Monitoring vegetation
systems in the great plains with ERTS, Third ERTS Symposium, NASA SP-351 I: 309-317
N/B: The slides below will not show on the webpage, but you can save/keep them on your computer and view them using the Adobe Flash Player 32 you downloaded earlier
Reflection
Q1] Which of the following is NOT a phenological variable we can gather from measuring NDVI with time:
– Range of measurable Photosynthesis
– Brown Days
– Time of minimum photosynthesis
– Net primary production
Q2] What is the range of NDVI and why is this important compared to the simple ratio?
Show Answer
Disadvantages of NDVI
- Saturates at high biomass content making it difficult to differentiate moderately high plant cover from very high plant cover.
- Like the simple ratio, it tends to amplify atmospheric noise in the NIR and Red bands.
- Because of the noise problem it tends to be very sensitive to background variation
For further details See
chapter 11, Remote Sensing of the Environment: An Earth Resource Perspective, 5th edition, by John R. Jensen.
So even though NDVI is an improvement on SR in some respects e.g. it has a more manageable range there have been further indices developed to try and mitigate the disadvantages of NDVI.
Reflection
The data below is for Sand, Wet Sand and Black Soil. The table shows Red and NIR values against % of canopy cover and the graph shows NDVI against canopy cover.
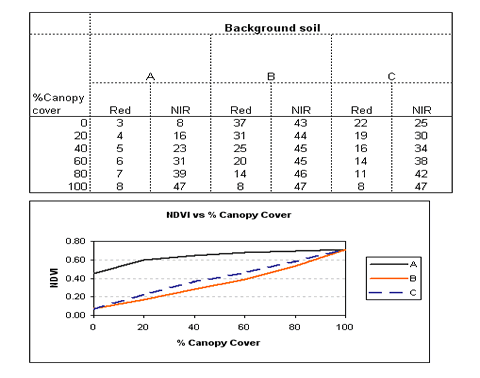
Q1] Identify which data set (A,B or C) matches with which soil/sand type
Q2] What does this tell you about the sensitivity of the NDVI when used on different soil types?
Show Answer
Soil Adjusted Vegetation Index (SAVI)
This index is designed to remove the dependency of the NDVI on brightness of background (soil) reflectance.
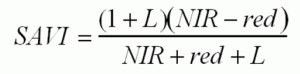
where L is a correction factor which ranges from 0 for very high vegetation cover to 1 for very low vegetation cover. The most typical value is 0.5 which is for intermediate vegetation cover.
Huete, A. R. (1988) “A Soil-Adjusted Vegetation Index (SAVI),” Remote Sensing of Environment, vol. 25, pp. 295-309.
Indices for Specific Property Monitoring
There are various indices designed to monitor specific properties. We will discuss two examples below: EVI and MTCI.
Enhanced Vegetation Index (EVI)
which is designed to estimate leaf area index and canopy structure and thus provide information on vegetation amount.
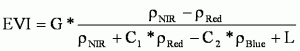
PNIR , PRed and PBlue are partially atmosphere corrected (Rayleigh and
ozone absorption) surface reflectances for NIR, red and blue MODIS bands
G is gain factor,
C1 and C2 are the coefficients of the aerosol resistance term
L is the canopy background brightness correction factor.
The coefficients used in the EVI algorithm are G =2.5, C1=6, C2=7.5 and L=1
HUETE, et al., 2002, Overview of the radiometric and biophysical performance
of the MODIS vegetation indices. Remote Sensing of Environment, 83, 195-213.
N/B: The slides below will not show on the webpage, but you can save/keep them on your computer and view them using the Adobe Flash Player 32 you downloaded earlier
MTCI
The MERIS Terrestrial Chlorophyll Index (MTCI) is designed to estimate chlorphyll content in the vegetation canopy and thus provide information on vegetation condition.
N/B: The slides below will not show on the webpage, but you can save/keep them on your computer and view them using the Adobe Flash Player 32 you downloaded earlier
Summary
Remote sensing can provide both qualitative and quantitative information on Earth surface properties.
Spectral indices have better sensitivity than individual spectral bands for detection of specific Earth surface properties.
Vegetation indices can provide information on amount (NDVI), Structure (EVI) and pigment content (MTCI) of different vegetation.
Vegetation indices can be used to manage, monitor and understand our environment.
References
For further details See chapter 11, Remote Sensing of the Environment: An Earth Resource Perspective, 5th edition, by John R. Jensen
DASH, J. and CURRAN, P. J., 2004, The MERIS Terrestrial Chlorophyll Index. International Journal of Remote Sensing, 25, 5003-5013.
Huete, A. R. (1988) “A Soil-Adjusted Vegetation Index (SAVI),” Remote Sensing of Environment, vol. 25, pp. 295-309.
HUETE, et al., 2002, Overview of the radiometric and biophysical performance of the MODIS vegetation indices. Remote Sensing of Environment, 83, 195-213.
Lambin, E. and Strahler, A. (1994). Change-vector analysis: a tool to detect and categorize land-cover change processes using high temporal-resolution satellite data. Remote Sensing of Environment, (48):231–244.
Myneni, R., Keeling, C., Tucker, C., Asrar, G., and Nemani, R. (1997). Increased plant growth in the northern high latitudes from 1981 to 1991. Nature, (386):698–702.
Rouse, J.W., R.H.Haas, J.A.Schell, and D.W.Deering, 1973: Monitoring vegetation systems in the great plains with ERTS, Third ERTS Symposium, NASA SP-351 I: 309-317
Activity
Review the advantages and disadvantages of the SR, NDVI, SAVI and MERIS Indices and post in the Discussion board on Blackboard(not -graded).