Recent Comments
Archives
Categories
- No categories
Meta
6.2. The Landsat Programme
Objectives
The purpose of this learning object is to introduce the key characteristics of the Landsat Program, which has been one of the longest-running and most influential of remote sensing satellite programs. The learning object describes the history of the program and explores how developments in sensor technology in particular have influenced the characteristics of the data available.
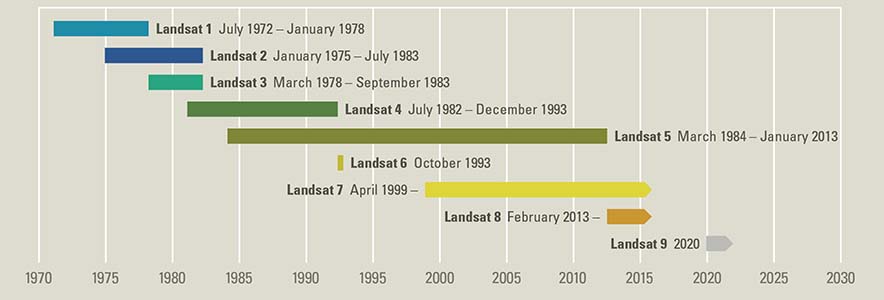
Landsat is a series of Earth-observing satellite missions jointly managed by NASA and the US Geological Survey (USGS). Landsat was driven by the exciting views from, and great success of, the early meteorological satellites in the early 1960s as well as from images taken during manned spacecraft missions. NASA launched the first Landsat satellite on 23 July 1972, initiating the world’s longest continuously acquired collection of space-based land remote sensing data. Landsat was originally named Earth Resources Technology Satellite (ERTS). The most recent launch (Landsat 8) was on 11 Feb 2013.
(Image source: USGS)
There is no Landsat 6 satellite in the series as it failed at launch after not reaching the velocity required to obtain orbit on 5 October 1993. Landsat 7 was launched successfully in 1999, however, in 2003 its scan line corrector failed. Therefore, images collected by Landsat 7 are ‘stripped’-with gaps of data, particularly in the edges of the scene. The Landsat Data Continuity Mission (LDCM) – Landsat 8 was launched in February 2013 . It consists of two isntruments: Operational Land Imager (OLI) and the Thermal Infrared Sensor (TIRS).
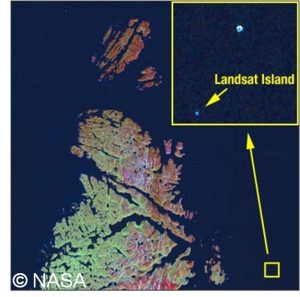
Landsat Island
Landsat Island is a small island 20km off the northeast coast of Labrador that was first detected by the Landsat 1 satellite, hence its name. It is an icy isle 25m wide and 45m long inhabited only by polar bears but marks the eastern-most extremity of the Canadian landmass but due to its location, Canada’s territory grew by 68km2 (NASA,
http://landsat.gsfc.nasa.gov/?p=258
(Image source: NASA)
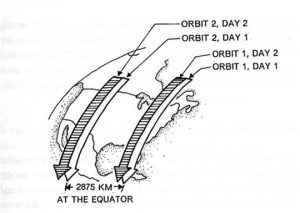
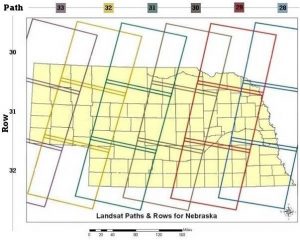
The Landsat satellites scan the earth in their descending (north to south) orbits, crossing the equator in the morning, between 08.30 and 10.00 local time. The swath is 185km. The Landsat missions have a revisit time of approximately 16 days.
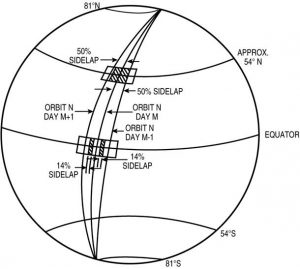
Orbits are closer at the poles than at the equator, with successive orbits being 2875km apart (at the equator). There is a sidelap between consecutive day acquisition, the amount of which changes with latitude.
A number of different sensors have been carried on board the Landsat series of satellites, including
- Return Beam Vidicon (RBV) camera
- Multi Spectral Scanner (MSS)
- Thematic Mapper (TM)
- Enhanced Thematic Mapper+ (ETM+)
- Operational Land Imager (OLI) and the Thermal Infrared Sensor (TIRS)-Landsat 8
The Landsat satellites carried these sensors as follows:
| Satellite Sensor | |
| Landsat 1 MSS/RBV | |
| Landsat 2 MSS/RBV | |
| Landsat 3 MSS/RBV | |
| Landsat 4 MSS/TM | |
| Landsat 5 MSS/TM | |
| Landsat 7 ETM+
Landsat 8 OLI and TIRS |
Return Beam Vidicon
This consisted of three TV-like cameras aimed to view the same 185km x 175km ground area simultaneously with a ground resolution of 80m over three spectral bands:
- 0.475-0.575 µm – Green (Band 1)
- 0.580-0.680 µm – Red (Band 2)
- 0.690-0.830 µm – NIR (Band 3)
This sensor was discontinued due to technical difficulties.
Multi Spectral Scanner
The MSS instrument has operated on the first five Landsat satellites. MSS systems on Landsats 1-3 were the first systems capable of producing multi-spectral data in a digital format. MSS is an across-track scanner with a ground resolution of 80m. Data are acquired in 4 spectral bands with 7 bit radiometric resolution (128 values).
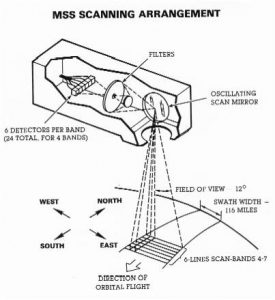
MSS consists of 4 spectral bands in the visible and NIR region. Landsat 3 had an additional band: Band 8 Thermal infra-red (10.4-12.6 µm).
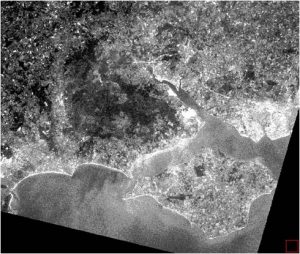
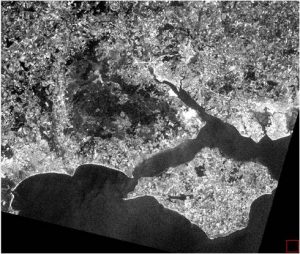
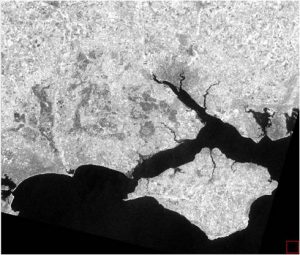
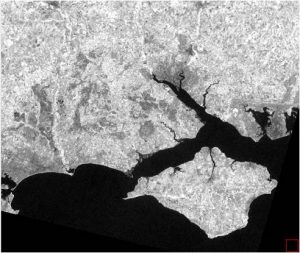
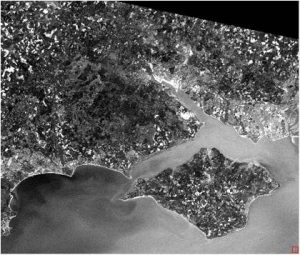
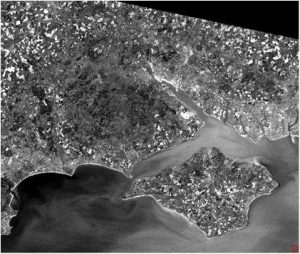
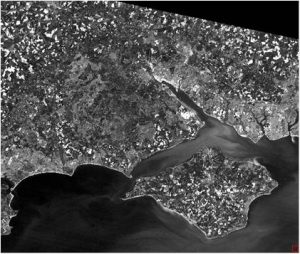
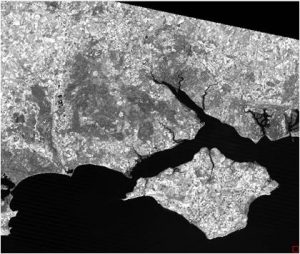
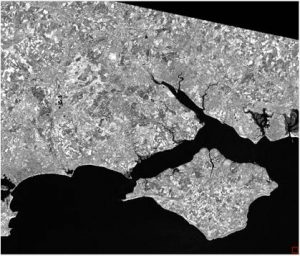
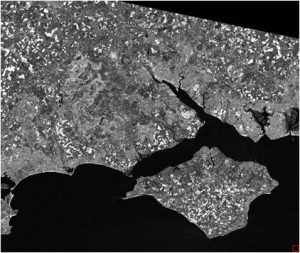
Here we see the four MSS bands for Southampton and the Isle of Wight: Top Left Band 1; Top Right Band 2; Bottom Left Band 3 and Bottom Right Band 4:
Thematic Mapper
The TM sensor was carried on board Landsat 4 and 5 along with MSS, hence has the same aerial as MSS. TM is a more advanced version of the MSS system. Advances include:
- Acquisition in 7 bands instead of 4
- New bands in the visible, mid infrared and thermal ranges
- Improved spatial resolution to 30m
- Improved radiometric resolution to 8 bit (256 values)
| Band number | Wavelength (µm) | Resolution (m) | Application |
| 1 | 0.45-0.52 Blue-Green | 30 | Water depth and quality; soil and vegetation differentiation |
| 2 | 0.52-0.60 Green | 30 | Green reflectance by healthy vegetation |
| 3 | 0.63-0.69 Red | 30 | Chlorophyll absorption for plant species differentiation |
| 4 | 0.76-0.90 Near IR | 30 | Biomass surveys, water body delineation |
| 5 | 1.55-1.75 Mid IR | 30 | Vegetation moisture measurement, snow and cloud differentiation |
| 6 | 10.40-12.50 Thermal IR | 120 | Plant heat stress measurement, thermal mapping |
| 7 | 2.08-2.35 Mid IR | 30 | Hydrothermal mapping |
Here we see six TM bands for Southampton and the Isle of Wight: Top Left Band 1; Top Right Band 2; Middle Left Band 3; Middle Right Band 4; Bottom Left Band 5 and Bottom Right Band 7:
Enhanced Thematic Mapper+
The ETM+ sensor is carried on board Landsat 7, on which it is the only instrument. It extends the capabilities of the TM by:
- Thermal Band 6 resolution is improved to 60m
- An additional 15m resolution panchromatic channel (0.52-9.0 µm)
- Improved technology, calibration and data transmission efficiency
These slides illustrate the differences between MSS and TM for the Southampton and Isle of Wight study region:
N/B: The slides below will not show on the webpage, but you can save/keep them on your computer and view them using the Adobe Flash Player 32 you downloaded earlier
Landsat 8 -OLI and TIRS
Landsat 8 carries two instruments: the Operational Land Imager (OLI), which on top of having the previous Landsat bands includes a deep blue band for coastal/aerosol studies, a shortwave infrared badn for cirrus detection and a quality assessment band. The Thermal Infrared Sensor (TIRS) provides two thermal bands. The OLI and TIRS have an improved signal to noise ratio(SNR) radiometric performance of up to 12-bits(as opposed to previous instruments which had only 8-bits). Its products are delivered as 16-bit images (i.e. higher grey scale levels =55,000 levels). Landsat bands are shown below:
| Band |
Wavelength |
Resolution | Useful for mapping |
| Band 1 – coastal aerosol |
0.43 – 0.45 |
30 | coastal and aerosol studies |
| Band 2 – blue |
0.45 – 0.51 |
30 | Bathymetric mapping, distinguishing soil from vegetation and deciduous from coniferous vegetation |
| Band 3 – green |
0.53 – 0.59 |
30 | Emphasizes peak vegetation, which is useful for assessing plant vigour |
| Band 4 – red |
0.64 – 0.67 |
30 | Discriminates vegetation slopes |
| Band 5 – Near Infrared (NIR) |
0.85-0.88 |
30 | Emphasizes biomass content and shorelines |
| Band 6 – Short-wave Infrared (SWIR) 1 |
1.57 – 1.65 |
30 | Discriminates moisture content of soil and vegetation; penetrates thin clouds |
| Band 7 – Short-wave Infrared (SWIR) 2 |
2.11 – 2.29 |
30 | Improved moisture content of soil and vegetation and thin cloud penetration |
| Band 8 – Panchromatic |
0.50 – 0.68 |
15 | 15 meter resolution, sharper image definition |
| Band 9 – Cirrus |
1.36 – 1.38 |
30 | Improved detection of cirrus cloud contamination |
| Band 10 – TIRS 1 |
10.60 – 11.19 |
100 * (30) | 100 meter resolution, thermal mapping and estimated soil moisture |
| Band 11 – TIRS 2 |
11.5 – 12.51 |
100 * (30) | 100 meter resolution, Improved thermal mapping and estimated soil moisture |
* TIRS bands are acquired at 100 meter resolution, but are resampled to 30 meter in delivered data product.
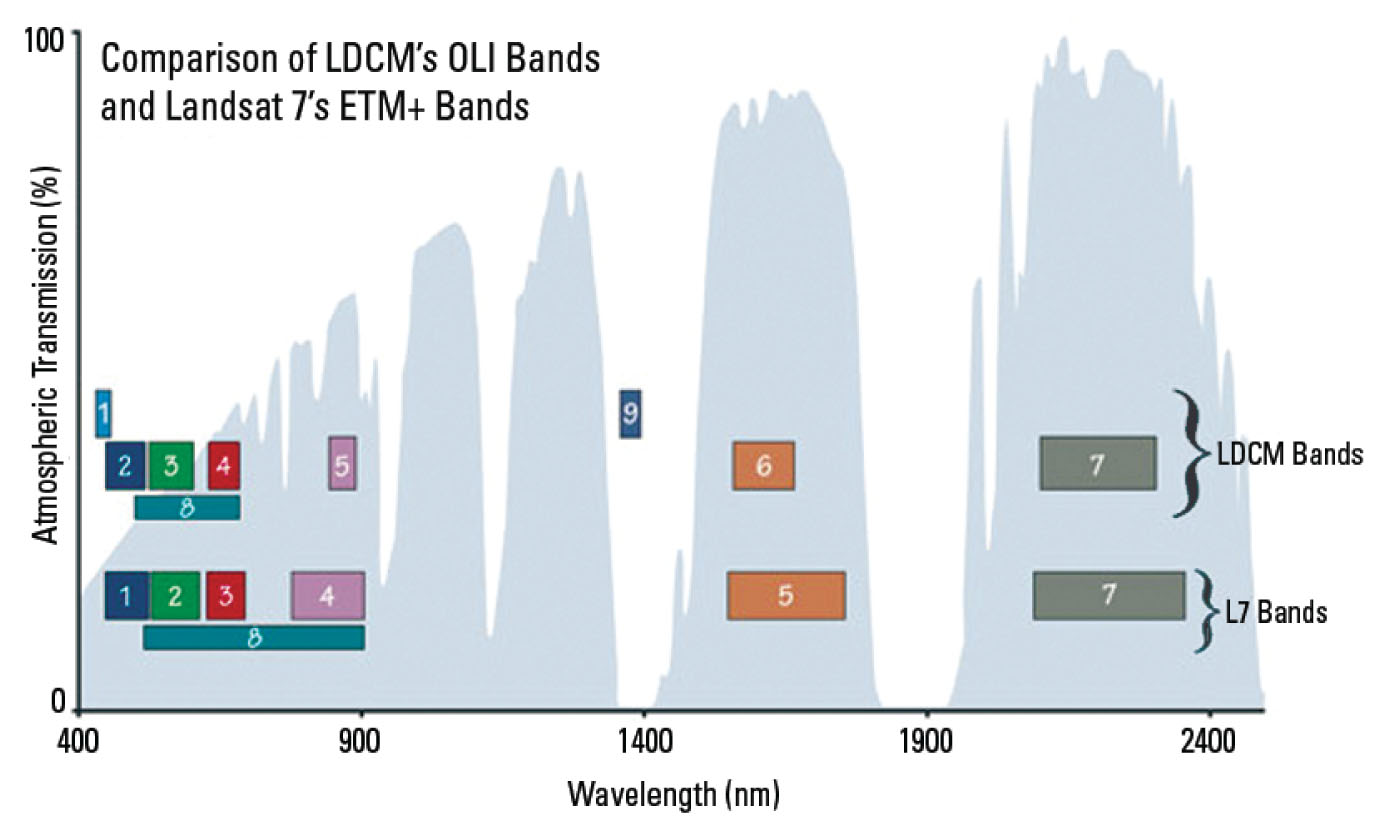
A comparison of Landsat 7 and Landsat 8 bands are shown in the figure below (Note that the Landsat 8 bands are narrower)
Activity
There are many resources on the Landsat Program provided by NASA at http://landsat.gsfc.nasa.gov/. Use this site to explore further details of the program. In particular, seek to become more familiar with the different uses of the various MSS and TM bands. An understanding of the land surface types which are best differentiated by the different bands is key to application of the Landsat imagery to different purposes. Seek also to identify examples of how the Landsat images have been used.