Recent Comments
Archives
Categories
- No categories
Meta
5.5. Spectral Resolution
Objectives
The purpose of this learning object is to introduce the concept of spectral resolution.
Spectral resolution refers to the number and dimension of specific wavelength intervals of electromagnetic radiation that a sensor is capable of measuring.
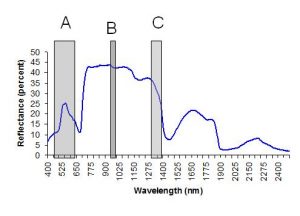
The portions (ranges) of the spectrum to which an instrument is sensitive are referred to as its bands. A sensor can have multiple bands and bands can be of different widths. However, within each band, no variation can be resolved. The width of each band determines its spectral resolution. In this example, the resolution of band A is lower than that of band C which is in turn lower than that of band B:
A panchromatic image consists of one wide band that encompasses a large spectral range (often the entire visible spectrum).
A multispectral image consists of several relatively narrower bands of which two or three bands are in the visible range and there may also be some in near-infrared or middle infrared bands.
A hyperspectral image consists of a large number of narrower bands spread across the electromagnetic spectrum.
Spectral Resolutions: Terms Explained
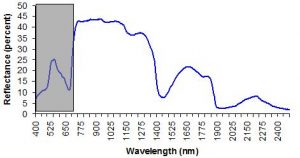
Panchromatic
Multispectral
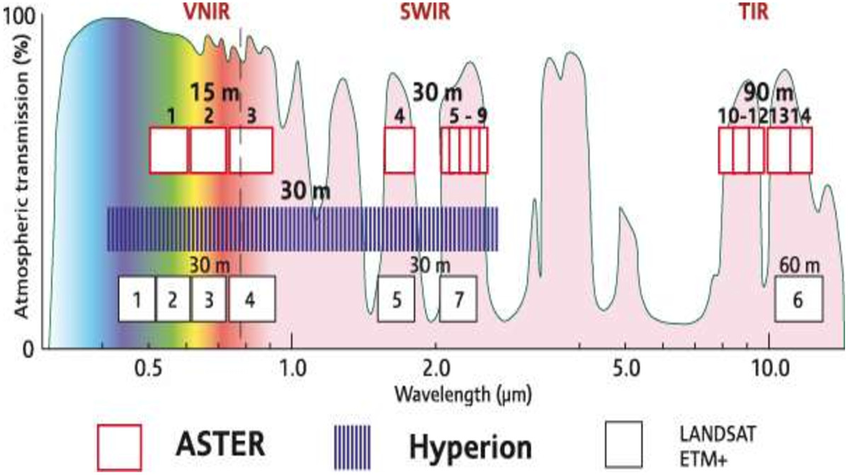
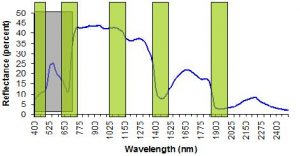
Hyperspectral (Hyperion sensor bands)
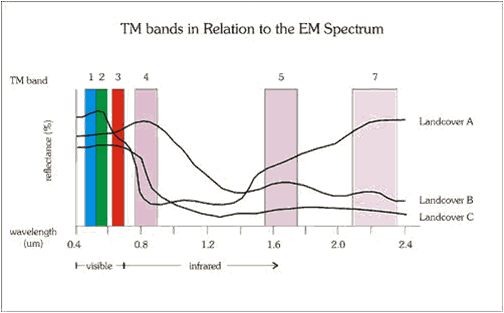
A practical example is provided by the Landsat Thematic Mapper (TM) sensor which is a multispectral sensor having seven bands, not all of which have the same spatial resolution.
| Wavelength | Resolution (micrometers) | GRE (m) |
| Band 1 | 0.45 – 0.52 | 30 |
| Band 2 | 0.52 – 0.6 | 30 |
| Band 3 | 0.63 – 0.69 | 30 |
| Band 4 | 0.76 – 0.9 | 30 |
| Band 5 | 1.55 – 1.75 | 30 |
| Band 6 | 10.4 – 12.5 | 120 |
| Band 7 | 2.08 – 2.35 | 30 |
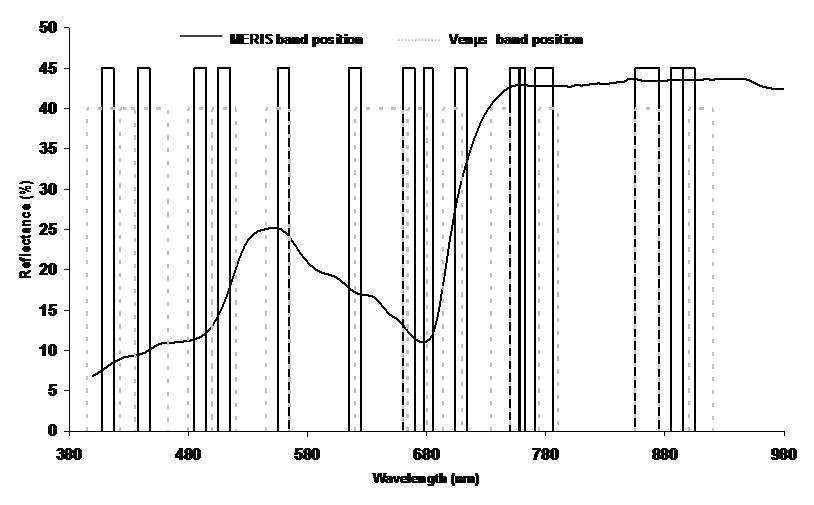
By contrast, the Medium Resolution Imaging Spectrometer (MERIS) (no longer in orbit) had 15 bands:
| Band No. | Band centre (nm) | Width (nm) |
| 1 | 412.5 | 10 |
| 2 | 442.5 | 10 |
| 3 | 490 | 10 |
| 4 | 510 | 10 |
| 5 | 560 | 10 |
| 6 | 620 | 10 |
| 7 | 665 | 10 |
| 8 | 681.25 | 7.5 |
| 9 | 708.75 | 10 |
| 10 | 753.75 | 7.5 |
| 11 | 760.625 | 3.75 |
| 12 | 778.75 | 15 |
| 13 | 865 | 20 |
| 14 | 890 | 10 |
| 15 | 900 | 10 |
Reflection
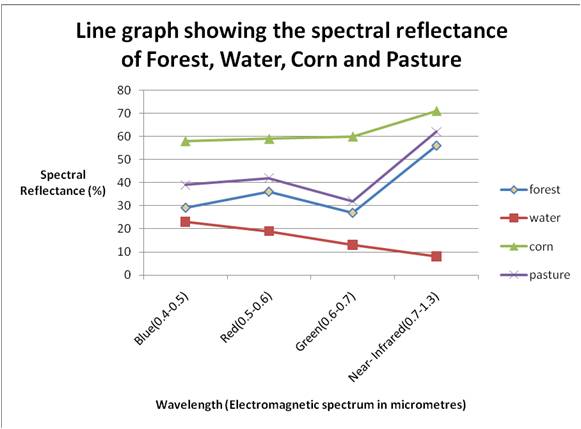
| Spectral reflectance | ||||
| Blue (0.4 – 0.5) | Green (0.5 – 0.6) | Red (0.6 – 0.7) | Near Infrared (0.7 – 1.3) | |
| Forest | 29 | 36 | 27 | 56 |
| Water | 23 | 19 | 13 | 8 |
| Corn | 58 | 59 | 60 | 71 |
| Pasture | 39 | 42 | 32 | 62 |
The table shows the spectral reflectance characteristics of four land uses across four wave bands. Using these data, consider the following two questions:
(a) Plot spectral signature for Forest, Water, Corn and Pasture using the data from the table above. (X axis-Wavelength, Y axis Spectral reflectance)
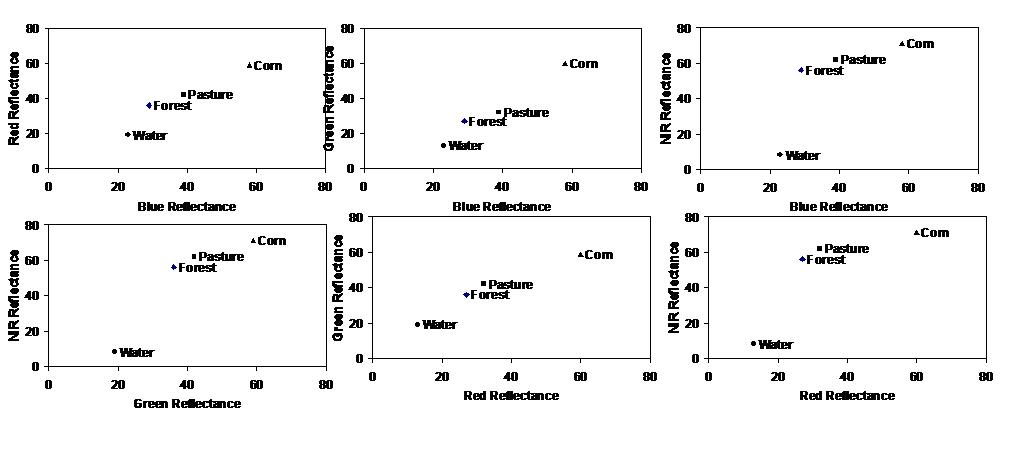
(b) Which of the two band combinations are most useful for distinguishing between these classes? (Hints: use different band combination scatter plots)
Show Answer