Recent Comments
Archives
Categories
- No categories
Meta
4.1. Electromagnetic Radiation and Plants
Why Plants?
Why are we interested in the interaction between EMR and Vegetation? The answer is that it is:
- Often the first surface encountered by the energy used for RS
- Plants play a vital role in the carbon cycle and thus global warming studies
- Plants can are an indirect indicator of geologic conditions and/or soil genesis/development
- We wish to study plants to know about plant disease, agriculture, forestry and climate change
The global distribution of vegetation is shown by this image
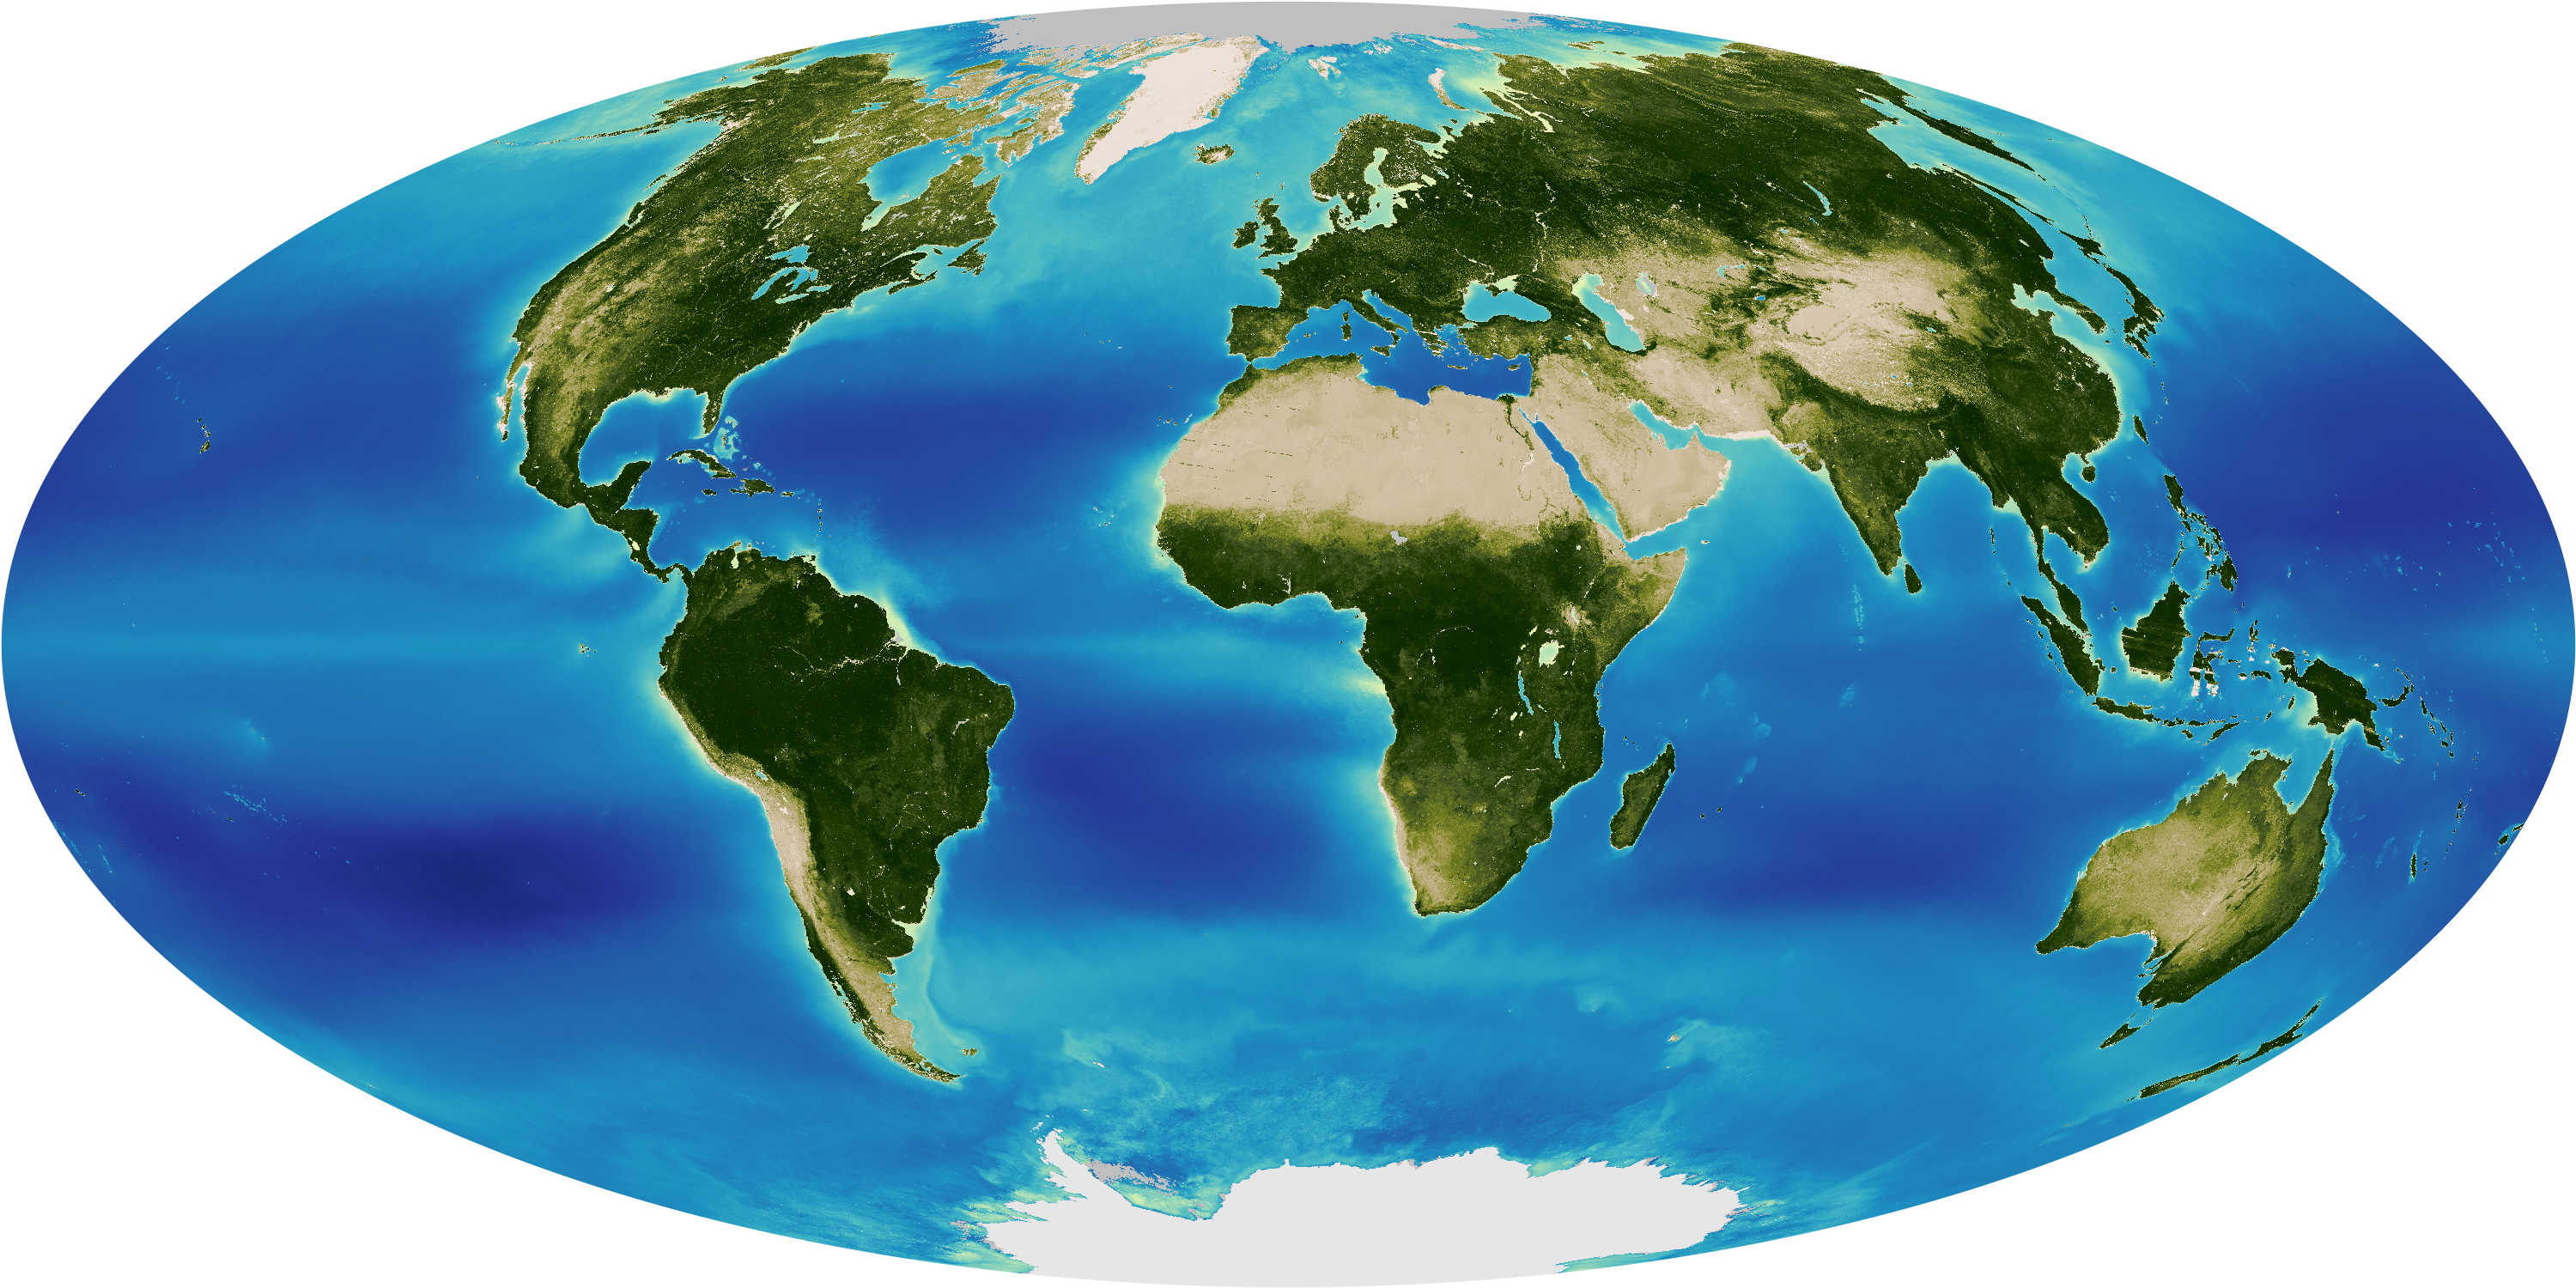
Greens show a covering of vegetation and deserts appear light brown. It is impossible at this scale to identify sub classes of vegetation.
The Effect of Plants on EMR
View this presentation, it discusses the effect of plants on the first two of these three types of EMR:
- Visible Light
- Near Infrared (NIR)
- Far Infrared
N/B: The slides below will not show on the webpage, but you can save/keep them on your computer and view them using the Adobe Flash Player 32 you downloaded earlier
Reflection
Which of the following features
- Leaf Structure
- Leaf Age
- Water absorption
- Chlorophyll absorption
are most characteristic in the wavelengths:
Visible, NIR, Far infrared.
Measuring Plant Reflectance
In this section so far we have examined a number of graphs of reflectance. How are these graphs produced? The answer is a ‘spectroradiometer’. These can be based in multiple locations:
- Laboratory: As we’ve seen so far
- Field: To measure reflectance under field conditions, measuring the reflectance at ground level without the effect of the atmosphere on the EMR from ground to instrument
- Airborne
- Spaceborne
Of course the spectra the instrument measures is dependent on the incident radiation so we need to calibrate the measurement by taking a measurement on a white panel with near perfect 100% reflectance at all wavelengths.
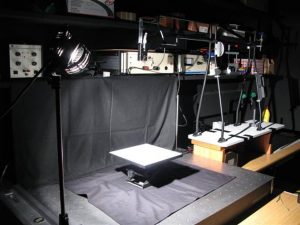
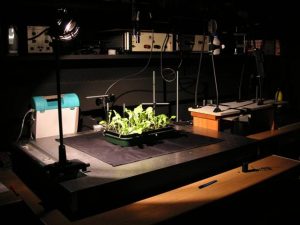
An example of a Radiometer from Southampton’s Lab: The FieldSpec 3 VNIR
Activity
Download the Liberty model (Leaf Incorporating Biochemistry Exhibiting Reflectance and transmittance Yields).
a] Unzip and run the model. Change the parameters:
- Click Parameters > Click the Input file button (above ‘Input File’) to define the output file. Needs to be changed for each run.
- Change Parameters as necessary > OK
- Now click simulation to run the model
b] Simulation runs to complete leaving everything else constant:
Chlorophyll:
20, 40, 60, 80…. and at 20 increments until ….160, 180 and 200
Water Content:
100, 120, 140 …. and at 20 increments until ….260, 280 and 300
c] Import the files into excel/matlab and plot the spectral reflectances for these parameters
d] Find a wavelength or wavelength range that is sensitive to chlorophyll and plot a graph between chlorophyll concentration and reflectance
Other Factors Effecting Spectral Reflectance of Vegetation
It is not just the relflectance of the plants themselves that controls the spectral radiation being emitted from a patch of ground, also having an effect:
- The reflectance of the soil beneath the plants
- Solar and sensor elevation
- Canopy geometry
- Phenology
References
Dawson, T.P., Curran, P.J. and Plummer, S.E. (1998), LIBERTY – Modelling the effects of leaf biochemistry on reflectance spectra, Remote Sensing of Environment, 65, 50-60.
Jago, R.M., M. E. J. Cutler and P. J. Curran (1999)
Estimating canopy chlorophyll concentration from field and airborne spectra. Remote Sensing of Environment 68 p217-224
USTIN, S. L., SMITH, M. O., JACQUEMOUD, S., VERSTRAETE, M. and GOVAERTS, Y., 1999, Geobotany: Vegetation mapping for Earth science. In Remote Sensing for the Earth Science: Manual of Remote Sensing, edited by A. N. Rencz, pp. 189-247 (New York: John Wiley &sons, Inc.)