Recent Comments
Archives
Categories
- No categories
Meta
3.3. Energy Interactions with the Earth’s Surface
Objectives
- To understand the key processes affecting the interaction between electro-magnetic radiation and the Earth’s surface and their implications for remote sensing
- To understand spectral signatures and their use in remote sensing
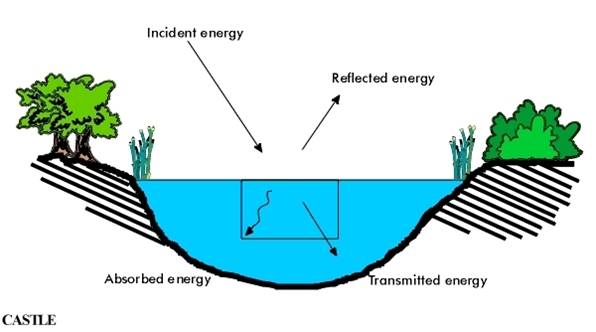
The interaction of electro-magnetic radiation with the Earth’s surface is driven by three physical processes: reflection, absorption, and transmission of radiation. Absorption involves a reduction in radiation intensity as its energy is converted on reaching an object on the Earth’s surface. Reflection involves the returning or throwback of the radiation incident on an object on the Earth’s surface, whilst transmission entails the transfer of radiative energy from an object on the Earth’s surface to surrounding bodies. Together, these three concepts make up an object’s radiative flux:
Φλ = ρλ + αλ +τλ [where Φλ is radiative flux; ρλ is the amount of reflected energy; αλ is the amount of absorbed energy; and τλ is the amount of transmitted energy]
These processes – reflection, absorption and transmission – are specific to each object on the Earth’s surface and so vary from one place to the next. Furthermore, a sensor as used in remote sensing measures just one of these, namely reflection (ρλ above).
A more specific concept, spectral reflectance, underpins much remote sensing. Spectral reflectance refers to the amount of reflectance in a specified wavelength range. Spectral reflectance depends on:
- the type of material at the Earth’s surface
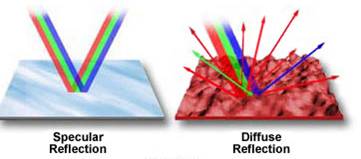
- the nature of the surface, particularly whether it is a rough surface or a smooth surface. Smooth surfaces produce what is known as specular reflection, where the reflected radiation is concentrated in a particular direction that can be calculated from the geometry of the object and source of incident radiation. Rough surfaces produce diffuse reflection, where radiation is reflected in disparate directions (see illustration below).
- the wavelength of the incident radiation
- other factors, such as the slope of the surface, its condition, and so on.
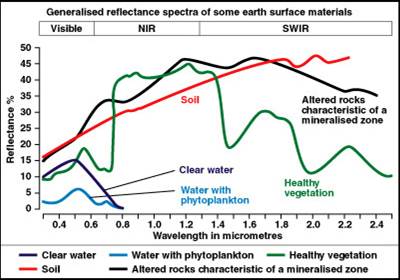
Each object on the Earth’s surface has its own unique spectral properties – reflection, absorption, and radiation. These properties combine to produce a spectral signature and it is these spectral signatures that can be used to distinguish one object from another. Spectral signatures are conventionally plotted as a percentage reflectance (on the Y axis) against wavelength (on the X axis). The illustration below shows some generalised spectral signatures for different types of Earth surface materials for the visible, near infra-red, and short-wave infra-red parts of the spectrum. Notice for example how the reflectance properties for water are lower across most wavebands than the terrestrial surfaces shown in this illustration.
A spectral signature can give us valuable insights into an object’s characteristics and we can of course crudely relate reflectance in the visible portion of the spectrum to its colour as perceived by the human eye (see illustration below).
N/B: The slides below will not show on the webpage, but you can save/keep them on your computer and view them using the Adobe Flash Player 32 you downloaded earlier
How far are we able to detect an object’s spectral signature? This is a crucial question in remote sensing and the answer depends amongst other factors on :
- the radiometric resolution of the sensor
- the amount of atmospheric scattering
- the surface roughness of the Earth object
- the degree of spatial variability in the remotely sensed imagery
Activity
Download this Excel spreadsheet, which contains some simple spectral signature data for different land cover types.
(a) Plot the spectral signatures for Forest, Water, Corn and Pasture using the data from the spreadsheet above. (remember that the X axis is wavelength and the Y axis spectral reflectance. You may well need to refer back to Unit 2 of this module to find the wavelength for each band in this file.
(b) Which of the two wavelength combinations are most useful for distinguishing between these classes? (Hints: try generating different scatter plots, which are based on different combinations of wavelengths, such as blue vs green, red vs blue, etc)