Recent Comments
Archives
Categories
- No categories
Meta
1.3. Applications of Remote Sensing
Some of the most important applications of remote sensing have been to observe global systems which require large-scale perspectives and particularly a concern to understand how the global environment is changing. The ability to gather repeated imagery over large and often inaccessible regions and to compare the characteristics of the surface at different dates provides us with unique insights, for example into human impacts on the Earth. This is equally applicable to land, water and atmosphere. Different remote sensing systems are better suited to these different applications.Figure 2 shows areas where remote sensing data can be used.
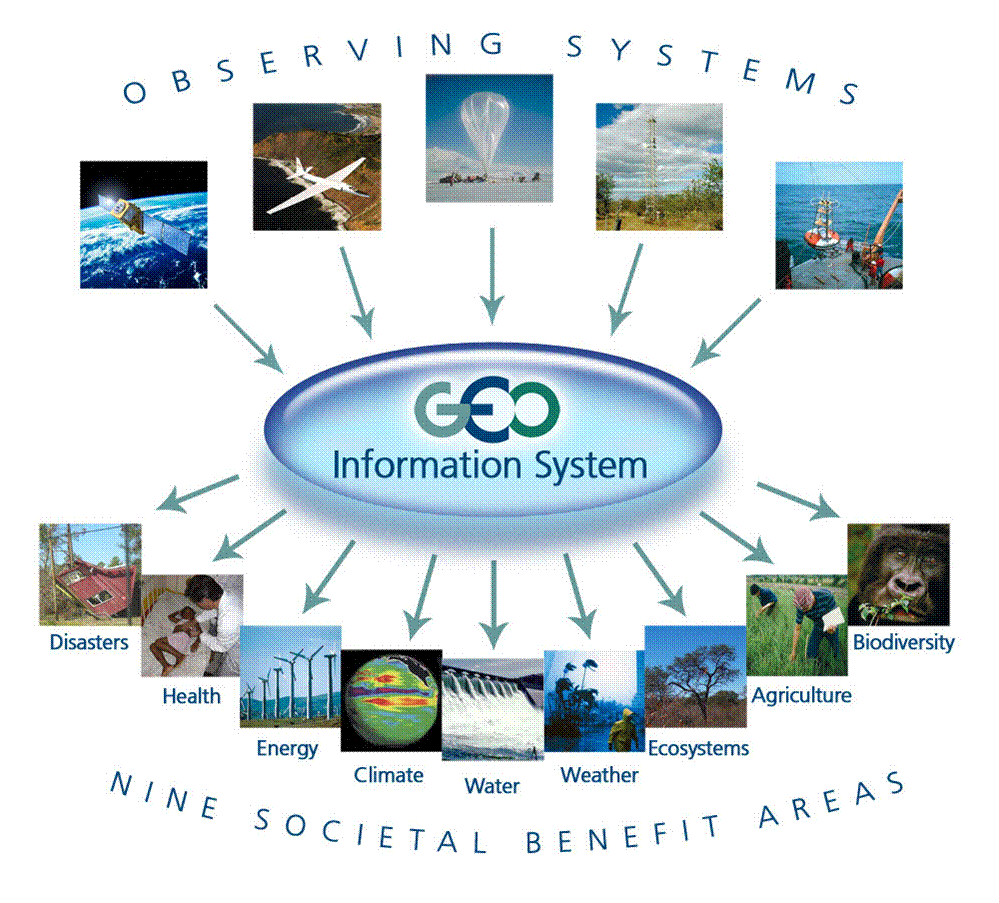
Figure 2: Societal application of remote sensing data
The following slide sequence has been taken from the United Nations Environment Programme (UNEP) “One Planet Many People” atlas and provides a powerful and inspirational introduction to the many environmental processes which can be revealed and studied through remote sensing.
N/B: The slides below will not show on the webpage, but you can save/keep them on your computer and view them using the Adobe Flash Player 32 you downloaded earlier
Although the visual images are impressive and can be informative in themselves, there is far too much information contained in even a simple scene for us to be able to fully assess it visually and a substantial amount of image processing is therefore usually required. Indeed, the data volumes produced by remote sensing are enormous. However, understanding the basic concepts allows us to be able to derive useful information (qualitative and quantitative) from remotely sensed data.
Examples of contemporary remote sensing application areas include:
- Meteorology – profiling of atmospheric temperature, pressure, water vapor, and wind velocity.
- Oceanography – measuring sea surface temperature, mapping ocean currents, and wave energy spectra.
- Glaciology – measuring ice cap volumes, ice stream velocity, and sea ice
distribution. - Geology – geomorphology, identification of rock type, mapping faults and
structure. - Geodesy – measuring the figure of the earth and its gravity field.
- Topography and cartography – improving digital elevation models
- Agriculture, forestry, and botany – monitoring the biomass of land vegetation, monitoring the health of crops, forecasting crop yields.
- Hydrology – assessing water resources from snow, rainfall and underground
aquifers. - Disaster warning and assessment – monitoring of floods and landslides, monitoring volcanic activity, assessing damage zones from natural disasters.
- Planning applications – mapping ecological zones, monitoring deforestation,
monitoring urban land use. - Oil and mineral exploration – locating natural oil seeps and slicks, mapping
geological structures, monitoring oil field subsidence. - Military – developing precise maps for planning, monitoring military infrastructure, monitoring ship and troop movements . . . (This is where most of the Government funding for remote sensing goes.)
Overall, advantages of remote sensing include large (and complete) spatial coverage; independence from surface constraints; repeatability; objectivity and affordability over large areas. Disadvantages include the requirement for extensive pre-processing; technological constraints associated with platforms and sensor systems and their operation and very importantly that many of the variables in which we are most interested cannot be directly measured. Hence we are often only able to capture surrogate variables about the things that interest us.
Activity
Students should visit the UNEP site at http://na.unep.net/OnePlanetManyPeople/book.php and explore further from the wide selection of themed Powerpoint presentations and remotely sensed images. Click on the Multimedia button and take one or two themes or geographical regions which are of particular interest to you and examine the resources for these in more detail, considering particularly to what extent the availability of remotely sensed data makes possible unique insights into the processes being described. Also consider whether the phenomenon of interest is being directly measured or whether some form of indirect measurement is taking place: what might be the implications of this? Share your observations with the course tutor and other students in the discussion forum.