
Rice is the world’s major staple food crop occupying over 12% of global cropland area (FAOSTAT, 2010) which produces around 800 million tons (FAO, 2017). Nearly 90% of the world’s rice is produced and consumed in Asian countries (FAO, 2000). Therefore, information on agricultural plantation area, yield, and production are essential to ensure food security of nearly 3 billion people (Rayfuse & Weisfelt, 2012).
At the moment this information is either lacking in many countries or only available post-harvest, this is too late to input into any effecting policy. Therefore, there is a pressing need to provide accurate and reliable yield estimation well ahead of harvest. In this project, we explore potential of multi source remote sensing data to provide country scale yield estimation in Thailand.
For optical sensor, the study utilised Sentinel 2 satellite data to develop common vegetation indexes (VIs) approach to derive essential crop biophysical variables such as Leaf Area Index. This is supplemented with information from microwave sensor such as Sentinel 1 to overcome issues with cloud. At the end, we produced a regular time series of crop biophysical variable across the growing season. These satellite-based estimates were validated with dedicated field campaign in three provinces covering the entire growing season.
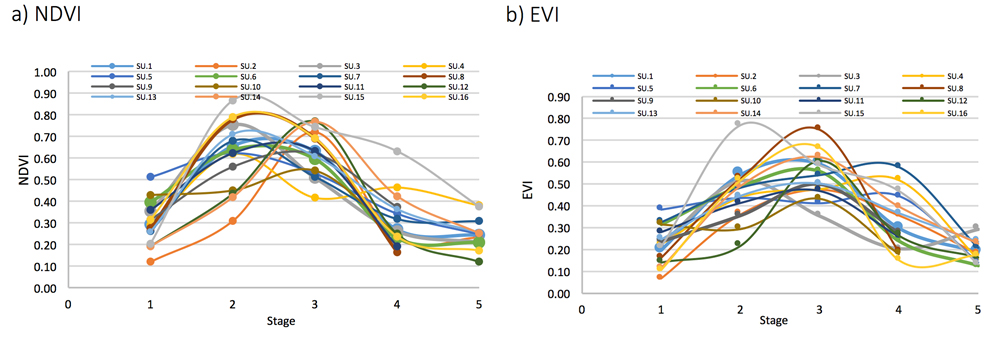
In terms of vegetation index, this research calculated two vegetation indexes such as Normalized Difference Vegetation Index (NDVI) and Enhanced Vegetation index (EVI). The result illustrated that the NDVI value peaked in tillering and panicle, flowering, seedling, and harvesting with 0.62, 0.34, 0.30, and 0.25, respectively. While EVI value are peaked in panicle, tillering, flowering, seedling, and harvesting stage with 0.53, 0.46, 0.36, 0.22, and 0.20, respectively. When consider with difference irrigation system, the NDVI value are quite difference in some rice growth stage particularly in panicle and flowering stage.
Furthermore, the result of backscatter coefficient (sigma naught) of rice in difference orbit directions and polarisations can display as figure2.
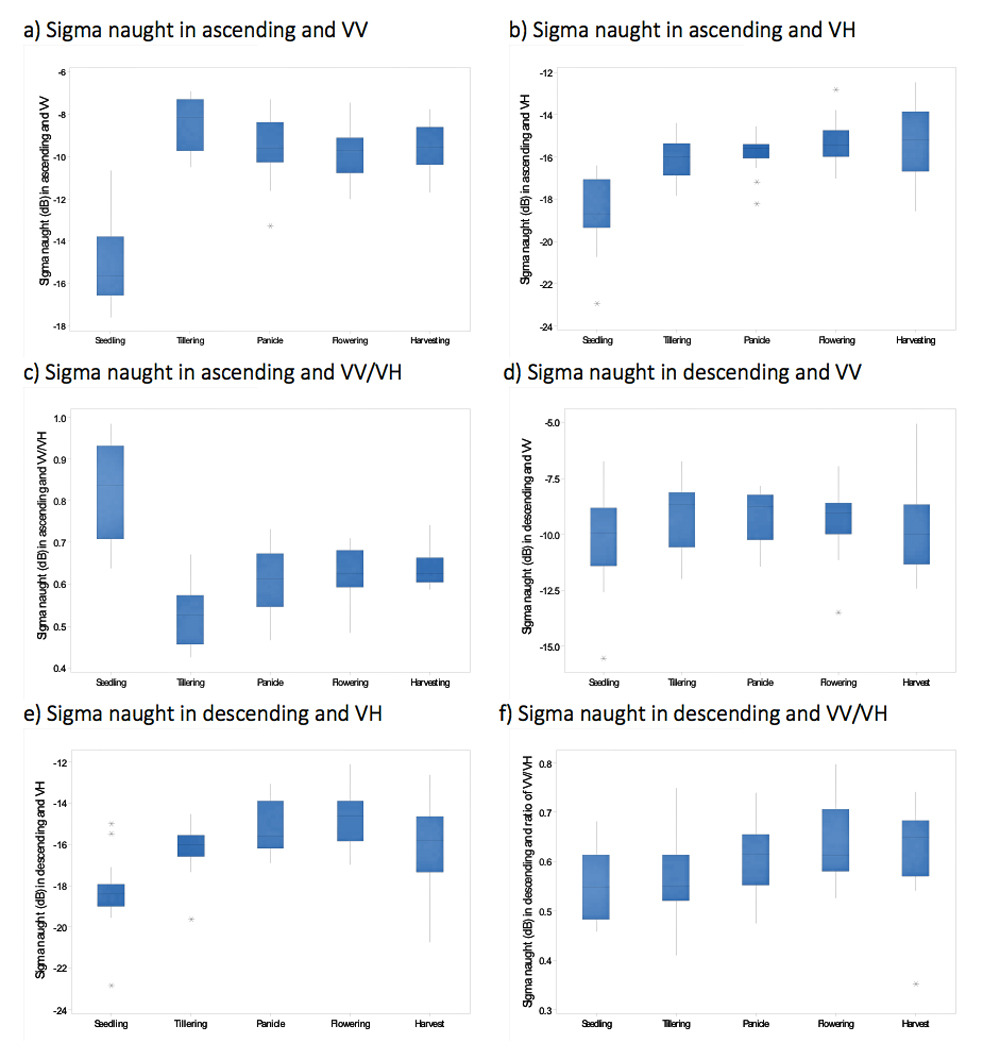
a) Sigma naught in ascending and VV, b) Sigma naught (dB) in ascending and VH, c) Sigma naught (dB) in ascending and VV/VH, d) Sigma naught (dB) in descending and VV, e) Sigma naught (dB) in descending and VH, and f) Sigma naught (dB) in descending and VV/VH in Phichit province.
Then, the present study analyse correlation between VIs, backscatter coefficient, and rice biophysical (e.g., absolute rice height, leaf area index, biomass (both wet and dry biomass), and yield).