LiDAR Data Processing for Basing House
Dan Joyce used Basing House for his major case study last year when studying for a Masters in Archaeological Computing. Dan has written some posts for us that summarise his research. This is the first in a series of posts about his work.
Thanks to Dan for taking time out to write these posts for us!
Basing House LiDAR data processing
– Dan Joyce
Airborne LiDAR (Light detection and ranging) involves the firing of a pulsed laser beam from an aircraft towards the ground, the lidar instrument being located spatially with a Global Positioning System (GPS) and the Internal Measurement Unit (IMU) in the aircraft. By recording the time it takes for each pulse to return to travel to the ground and back the location of a point on the ground can be accurately recorded to within a few centimetres. The laser records points at 2m intervals or less.
LiDAR allows the mapping of whole landscapes by providing accurate three-dimensional measurements of the ground surface. It has been used in archaeology to identify features not known before including those under tree cover, thanks to some of the beams passing through gaps in the canopy.
Some LiDAR data of Basing House and its surrounding area was procured from the Environment Department https://www.geomatics-group.co.uk/geocms/ prior to the 2013 excavations of the site in order to experiment with this useful resource.
I will be concentrating on the common ground to the south and east of the main site for this exercise. As can be seen in figure 1 the LiDAR data before processing doesn’t show very much.
N.B. The figures below all link to larger, high resolution versions of the images.
Raw LiDAR Data

Figure 1 – Raw LiDAR Data
Much like one of the techniques associated with the identification of archaeological elements from aerial photography, the use of oblique lighting is important in the analysis of lidar data, with changes in ground level caused by the archaeology being identified by the shadows that they cast.
The oblique lighting used in analysing lidar data however is artificially created by a computer program producing the same results as in aerial photography. This process is called hill-shading and the azimuth and elevation angle can be set within the relevant computer program, whether GIS (Geographic Information System) or other software. The elevation can also be exaggerated increasing the visibility of archaeological features.
LiDAR Data with Hillshade
Figure 2 shows LiDAR data with a hill-shade applied, as can be seen a number of interesting features can be seen in the data of the common.
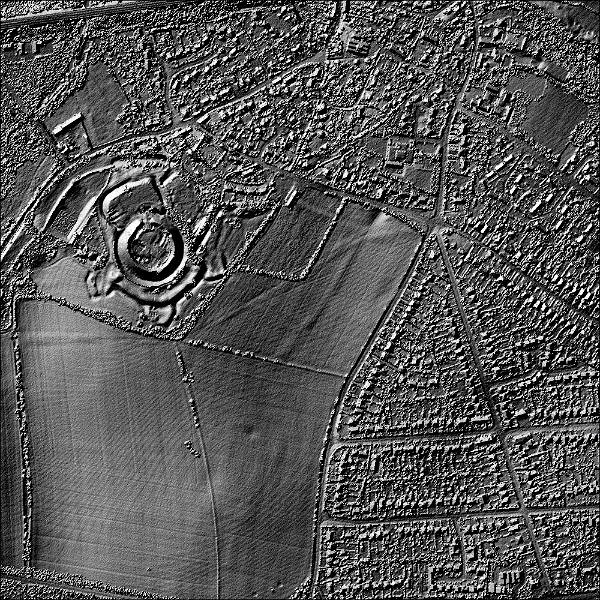
Figure 2 – LiDAR Data with Hillshade.
Although very useful the problem with this process is that if a feature is facing into the direction of illumination it casts no shadow and so doesn’t appear in the visualisation. This can be solved by creating multiple hill-shaded images from different directions, these can be combined to provide a visualisation with the data from all of the different hill-shades visible. This is done by altering the transparency of the different layers so that the data shows through. The different hill-shaded images can be colourised to show up the different elements more clearly.
LiDAR Data with Multiple Hillshades
As can be seen in figure 3, hill-shaded images from multiple angles bring out features that are not visible with a single illumination direction.
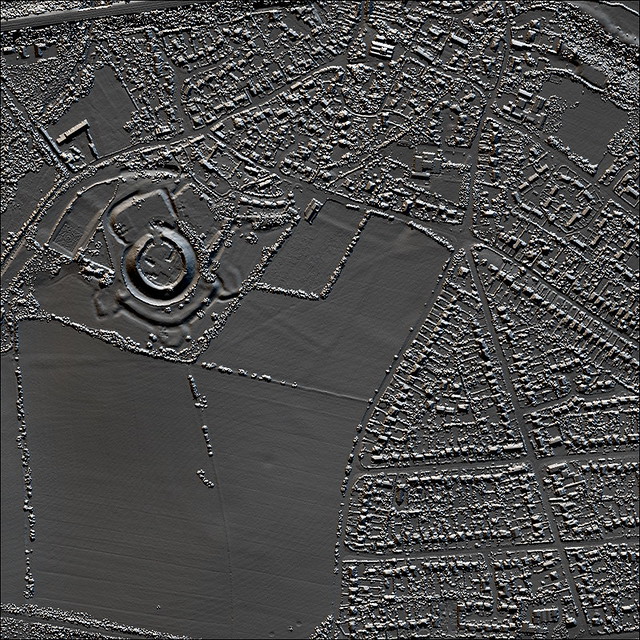
Figure 3 – LiDAR Data with Multiple Hillshades.
LiDAR Data with Multiple Hillshades plus Principal Component Analysis
A final process that was run is principal component analysis (PCA), this is where a single composite image composed of a number of hill-shaded images is created. As can be seen in figure 4 all of the features visible on the common are made much clearer by this process suggesting that some very interesting archaeology is present.
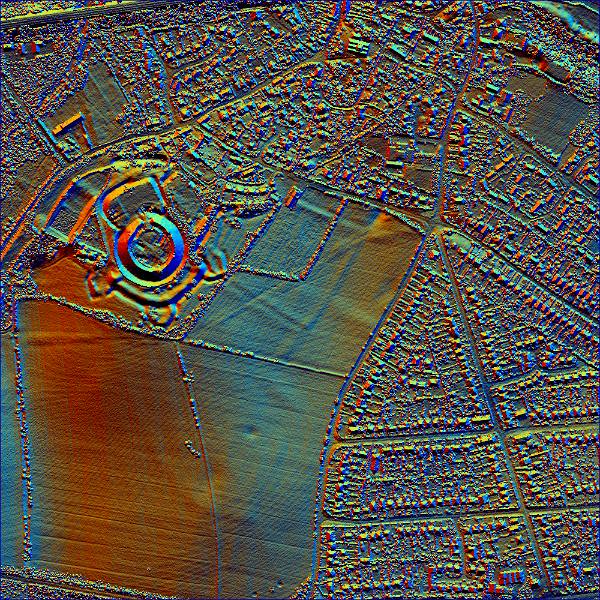
Figure 4 – LiDAR Data with Multiple Hillshades and with Principal Component Analysis (PCA).
As can be seen from the results a great deal of information can be gleaned from this process adding to what is already known about the site, in combination with the geophysical survey undertaken in the same area. A number of other processes can be run on lidar data to enhance what its visible but none of them worked any better than those I used here.
The software used for this blog was the ‘Relief Visualization Toolbox’ available from the Research Centre of the Slovenian Academy of Sciences and Arts (ZRCSAZU) website: http://iaps.zrc-sazu.si/index.php?q=en/svf#v
Further information about the use of LiDAR in Archaeology can be gained from the English Heritage publication “The Light Fantastic – Using airborne LiDAR in archaeological survey” available in .pdf format from their website – http://www.english-heritage.org.uk/professional/research/landscapes-and-areas/aerial-survey/archaeology/lidar/.
Filed under: Dan Joyce, Data Processing, Digital Methods, Summer Excavation Tagged: basingstoke common, data processing, digital methods, hillshades, Lidar


