A first look at my Bodiam data
Last week, I had a look at the developing script for the new Bodiam Castle interpretive experience (for want of a better word). It’s all looking very exciting. But what I should have been doing is what I’m doing now, running the responses from the on-site survey I did last year through R, to see what it tells me about the experience with out the new … thing, but also what it tells me about the questions I’m trying out.
A bit of a recap first. One thing we’ve learned from the regular visitor survey the the National Trust runs at most of its sites, is that there is a correlation between “emotional impact” and now much visitors enjoy their visit. But what is emotional impact? And what drives it? In the Trust, we can see that some places consistently have more emotional impact than others. But those places that do well are so very different from each other, that its very hard to learn anything about emotional impact that is useful to those who score less well.
I was recently involved in a discussion with colleagues about whether we should even keep the emotional impact question in the survey, as I (and some others) think that now we know there’s a correlation, there doesn’t seem to be anything more we can learn by continuing to ask the question. Other disagree, saying the question’s presence in the survey reminds properties to think about how to increase their “emotional impact.”
So my little survey at Bodiam also includes the question, but I’m asking some other questions too to see if they might be more useful in measuring and helping us understand what drives the emotional impact.
First of all though, I as R to describe the data. I got 33 responses, though its appears that one or two people didn’t answer some of the questions. There are two questions that appear on the National Trust survey. The first (“Overall, how enjoyable was your visit to Bodiam Castle today?”) gives categorical responses and according to R only three categories were ever selected. Checking out the data, I can see that the three responses selected are mostly “very enjoyable” with a very few “enjoyable” and a couple “acceptable.” Which is nice for Bodiam, because nobody selected “disappointing” or “not enjoyable”, even though the second day was cold and rainy (there’s very little protection from the weather at Bodiam).
The second National Trust question was the one we were beating last week: “The visit had a real emotional impact on me.” Visitors are asked to indicate the strength of their agreement (or of course, disagreement) with the statement on a seven point Likert scale. Checking out the data in R, I can see everybody responded to this question, and the range of responses goes all the way from zero to six, with a median of 3 and mean of 3.33. There’s a relatively small negative skew to responses (-0.11), and kurtosis (peakyness) is -0.41. All of which suggests a seductively “normal” curve. Lets look at a histogram:
Looks familiar huh? I won’t correlate emotional impact with the “Enjoyable” question, you’ll have to take my word for it. Instead I’m keen to see what the answers to some of my other questions look like. I asked a few questions about learning, all different ways of asking the the same thing, to see how visitors’ responses compare (I’ll be looking for some strong correlation between these):
- I didn’t learn very much new today
- I learned about what Bodiam Castle was like in the past
- What I learned on the visit challenged what I thought I knew about medieval life, and
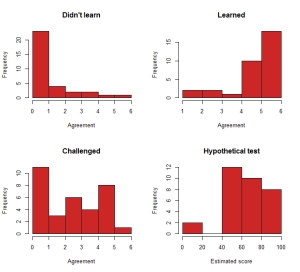
- If this were a test on the history of Bodiam, what do you think you you might score, out of 100?
The first three use the same 7 point Likert scale, and the last is a variable from 1 to 100. Lets go straight to some histograms:
What do these tell us? Well, first of all a perfect demonstration of how Likert scale questions tend to “clumpiness” at one end or the other. The only vaguely “normal” one is the hypothetical test scores. The Didn’t Learn data looks opposite the Learned data, which given these questions are asking the opposite things, is what I expected. I’m sure I’ll see a strong negative correlation. What is more surprising is that so many people disagreed that they’d learned anything that challenged what they thought they knew about medieval life.
An educational psychologist might suggest that this shows that few few people had in fact, learned anything new. Or it might mean that I asked a badly worded question.
I wonder which?


