Contemplating Data Analysis and Narrative
The lengthy period since my last blog post represents a diversion from the usual pattern of fieldwork and rapid turn-around of research reports and has provided some time for reflection on the nature of the types of data we collect as archaeologists and what we do with it. Much of the work of recent months has been related to large-scale research projects, and the analysis and interpetation of varying forms of geophysical and archaeological data to a number of different research agendas. The need for focus for some of the data interpretation really precluded the kind of mindset that allowed for easy blogging over the time, and it was this that prevented any reflection here. Other areas of the data analysis in theory would have provided some good material for an outlet, but it is only arriving at this point, with a little breathing space before moving on to the next datasets, that it seemed prudent to take to the blog.
Several projects have been central to developing these thoughts. In August students and staff from the University of Southampton worked with students from Northwestern University in the USA, under the direction of Professor Matthew Johnson, at Knole Park and Ightham Mote in Kent. The survey was founded on an integrated methodology of topographical and geophysical survey, with the principal aim being provision of field training for undergraduate students at both universities. The nature of this project contrasted sharply with the other areas of work; the assessment and writing up of survey for the Theban Harbours and Waterscapes Survey, under the direction of Dr Angus Graham, and the integration and interpretation of data from the Portus Project, directed by Prof. Simon Keay, for all of the GPR and ERT data collected from the areas of the Imperial Palace and the Severan Warehouses at the site. Although the techniques applied on both projects are similar (GPR, ERT), however, the nature of the datasets reflects the very different questions being asked about the areas. What is apparent from the post-fieldwork integration and analysis of data from all of these projects are the varying levels of interpretation required for the different project agendas, especially in the short to middle term.

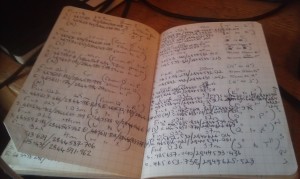
Field notebook used at Thebes. The day to day drudgery, graft and bon homie of the fieldwork conducted for the different project contrasts sharply with some of the more reflective moments of the processing and interpretation work akin to all projects. One of the tangible links between the fieldwork and desk-based worlds of the archaeological survey are the field notes; descriptions, ntes on weather conditions and, in the case of geophysical survey, lines of location data associated with thousands of profiles of GPR and ERT data, or to the location of grids in a magnetometer or earth resistance survey.
For some fieldwork the principal requirement is for a documentary record of the fieldwork that took place, with a general and sometimes cursory assessment of the survey results. The need for this approach can be the result of different pressures or outcomes of the field season; an interim report for an ongoing field project, mandatory requirements for reporting to overseas authorities, or a primary phase of investigation within a larger project. Having produced dozens of these reports over the years the exercise does prove useful in terms of the process of survey and relating to how the archaeologist forms an overview of the results of the fieldwork. The process allows the broad trends of the different datasets to be established, gives the the most expansive spatial and temporal view of the survey results in terms of the project objectives and provides an opportunity for pleasing imagery of the datasets to be reproduced. The short report does, however, present limitations. The broad bruch-strokes of cursory data analysis leaves out the details of the data, the smaller anomalies and features, the more controversial questions relating data to the known archaeological record, and the considered and established link between individual anomalies in the dataset, and their description and interpretation in detailed text. The summary analysis of the data is empirical in nature, and there is a risk of interpreting the work in black and white, in terms of research objectives met and archaeological facts maintained or overturned. Without further elucidation these fleeting assertion can become established facts in the mind of the archaeologist, highlighting the need for detailed assessment.

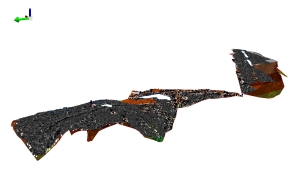
Magnetometer survey data from Knole Park, draped over the topographic surface derived from the GPS survey. The aesthetically pleasing image and the overview of the data all belie the need for a deep and reasoned analysis of what is essentially a high resolution dataset.
The analysis of geophysical survey data in archaeology is, to a large degree, based upon form or the morphology of anomalies within a dataset, together with the relative strengths or polarities of readings in the data. Archaeological evidence from excavation and coring can provide the surveyor with data that facilitates the correlation of hard data on the sediments and archaeological materials of an area with the non-intrusive data from survey, although such information is not always forthcoming. The morphology of anomalies becomes critical in the interpretation of spatially large-scale datasets where other archaeological data may be limited. This has been the case with two projects; the THaWS survey at Thebes, and the survey of the hinterland of Portus. In both instance the archaeolgoists have had to rely on the geophysical survey data, with limited excavation or borehole data present for the different areas. At Thebes, despite the massive quantity of archaeological remains on the West Bank and at Karnak, much of the survey work has focused on the Nile floodplain to the east of the extant archaeological remains. The nature of the deposits and constraints placed on the surveyors has meant that GPR and ERT have formed the principal methods of survey, with deep GPR profiles reaching 6-7m below the modern ground surface to locate potential archaeological features, complemented by ERT profiles reaching up to 19m in depth to assessthe geoarchaeological variations of the areas. While alignment of features with extant remains to the west has been possible. Some of the data interpretation is limited by the nature and quantity of associated archaeological evidence. Our interpretations and narrative therefore take on a cautious quality at times, as we cannot infer the presence of features without concrete evidence in the data, backed up by borehole survey and relating this to existing archaeological records. Our developing narrative for the landscape is thus providing new evidence for human interaction on the Nile floodplain, but is also changing the nuances of our methodological approach and epistomology. A similar approach is occuring on the Isola Sacra in the hinterland of Portus. Here there are fewer constraints on our ability to be able to survey in the landscape, although some varying land ownership and landuse has precluded survey in certain parts of the Tiber delta. However, our narrative to date has very much been based on the morphology of different anomalies, coloured by our existing knowledge of the landscape between Portus and Ostia Antica.

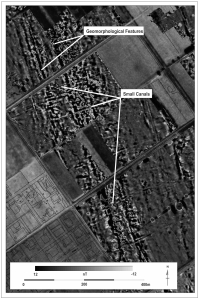
An example of the magnetometer data from the Isola Sacra. In spite of the high resolution expansive survey, our interpretations are limited by our existing knowledge of the landscape, leading to some general trains of narrative thought, but producing a number of unique surprises in the data, and opportunities for further investigation and clarification based on a continuous re-assessment of the methodology.
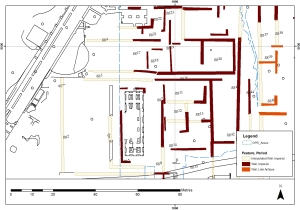
The massive scale of magnetometry in this landscape contrasts somewhat with the drtailed GPR and ERT surveys from within the archaeological park at Portus, with high resolution survey over smaller areas undertaken in close proximity to a number of seasons of excavation carried out by the Portus Project. Here the processing of and georeferencing of the data have occurred over the last few years, undertaken by a team of people, and the analysis and interpretation of the data have just been completed. What was immediately apparent from the data analysis was how a rigid system or process for analysing the data had to be established to deal with the complexity and three-dimensional nature of the datasets. The rationale ultimately was to pull order out of chaos, to take the complex representation of three-dimensional data and produce a sound interpretation and narrative for the data that could be understood in archaeological terms. The assessment of individual horizontal sections of the data, the creation of interpretative layers and the composite overlatying and assessment of these interpretations were key to this. The scrutiny that the data came under also allowed for detailed labelled plans to be produced, related to descriptive text using the labelling as a point of cross-reference. The interpretative layers could then be overlaid on the data from other datasets including the ERT, and plans of the site excavations.

Example of the interpretative layers for the geophysics at Portus. The interpretation alows for detailed description of features, feature measurement and relation of features to the surrounding excavation plans. At this level of interpretation are we becoming too abstract?
The level of analysis for these datasets provides a good opportunity for giving detailed descriptions of anomalies and interpretations of features. However, beyond the reach of the excavation areas, we are still dealing with the morphology and signal of anomalies, and to a greater or lesser degree an empirical interpretation of these anomalies. Many of the insights into the geophysics here will be provided by archaeological knowledge of architectural styles and methods, and relating these to the plan from the geophysics. However the survey results are already leading to the development of an informed archaeological narrative for the survey areas.
