Guest Blog: Will Heard – Spring 2013 Survey Results Part 2
Last week we published a guest post from Will Heard, as a summary of the Spring Survey that the University of Southampton students carried out this April-May. Here is Will’s second and final blog post about the survey results.
Thanks again to Will!
—
Basing House Spring Survey Part 2
by Will Heard, 2013 Will is a third year undergraduate student, with interests in survey, geophysics and the use of computers for archaeological purposes. He is interested in any period of history, having worked at Basing House and on a Bronze Age site amongst others. He is currently working on his undergraduate dissertation, which aims to use GIS systems to reveal the theoretical effectiveness against invasion of a small section of the World War II G.H.Q Line in Essex.The Motte Resistivity Survey
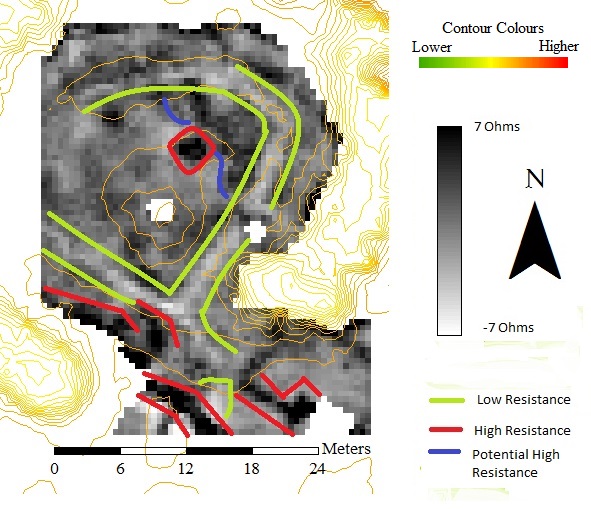
Figure 2 shows the resistivity plot of part of the Motte interior with notable features enclosed in coloured lines. The bottom left high resistivity feature is most probably related to the still accessible cellar, which can be seen as a large depression on the contours.
The high resistivity feature at the far bottom of the image has no associated topographic evidence, but it is situated in a position that may suggest it is a continuation of the feature running parallel to the cellar. If this is so, then the high resistivity feature next to the cellar may not be directly related to it after all. The other most interesting feature is the slight low resistance feature highlighted in green, which represents a dip on the topographic model. The ground raises up to a point which is a well (circled white in Figure 3). The presence of the well leads to the assumption that this area was some sort of courtyard or open air space. This is supported by Peer’s plan of his excavations (Figure 1).

Figure 1 – Plan of the Old House as excavated by Peers. After (Royal Archaeological Institute 1924: 362).

Figure 2 – Resistivity Survey of part of the motte interior. Notable features are enclosed by coloured lines. Negative ohm values caused by the high pass filter. Contours from a raster. ArcGIS 10.1.

Figure 3 – Motte interior resistivity draped over the 3D TIN surface. From the north. Light from the east at 45 degrees. Vertical exaggeration at 1.5.
The New House Resistivity Survey
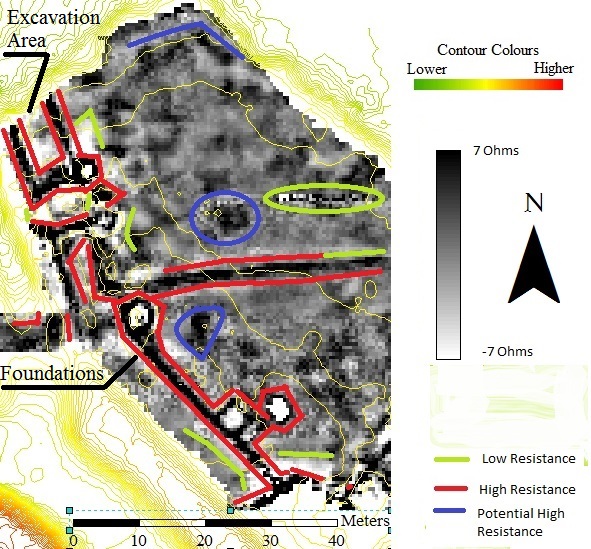
The New House site was the largest of the three areas surveyed with Resistivity and has a lot of strong features. The most obvious features are the straight lines along the entire left side of Figure 13. These are undoubtedly buried foundations of the raised New House.
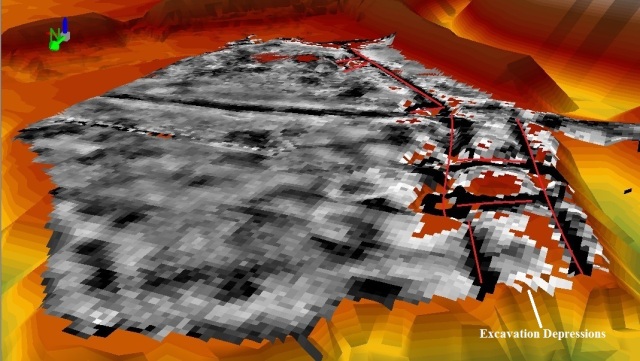
The circular anomalies are towers of the sort seen in Hollar’s drawing (see Figure 15). The strength of these anomalies suggests excellent preservation and indeed, an excavation uncovered some of these remains and did not fully fill in the trenches. The resulting depression in the topography can be seen in the foreground of Figure 14.
The very low (white) anomalies in the same area are possibly caused by a slow build-up of moist, humic soils in the unfilled excavation trenches. Given the aforementioned evidence, it appears unlikely the anomalies are of historical origin. However, further south in Figure 13, some of the unexcavated strong circular anomalies enclose areas of extremely low resistance. These may be the result of filled sunken floors, or quarrying straight after the final Civil War siege.
Another area of interest is on the right of Figure 13, which is circled by a green line. This area is highly variable, with pixels of very high and low resistance and it is unclear what these readings represent. More areas of interest include the horizontal line feature and various other patches of high resistance in Figure 13.

Figure 4 – Resistivity Survey of the New House area. Notable features are enclosed by coloured lines. Negative ohm values caused by the high pass filter. Contours from a raster. ArcGIS 10.1.

Figure 5 – New House resistivity plot draped over the 3D TIN. Red lines show features with associated topographic variations. From the north. Light from the east at 45 degrees. Vertical exaggeration at 1.5. ArcGIS 10.1.
![Figure 6 - Wenceslaus Hollar's 'The Siege of Basing House'. The text reads 'A THE OLD HOUSE. B. THE NEW. C. THE TOWER THAT IS HALFE BATTERED DOWN. D. KINGS BREASTWORKS. E. PARLAMENTS BREASTWORKS' [sic]. After (Wikipedia 2013)](http://basinghousecat.files.wordpress.com/2013/07/wenceslaus_hollar_-_the_siege_of_basing_house.jpg?w=640&h=325)
Figure 6 – Wenceslaus Hollar’s ‘The Siege of Basing House’. The text reads ‘A THE OLD HOUSE. B. THE NEW. C. THE TOWER THAT IS HALFE BATTERED DOWN. D. KINGS BREASTWORKS. E. PARLAMENTS BREASTWORKS’ [sic]. After (Wikipedia 2013)
References
(1924). Proceedings at Meetings of the Royal Archaeological Institute. The Archaeological Journal 81. Royal Archaeological Institute. 315-380. (Basing House pp. 359-364).
English Heritage (last updated 2004). National Monuments Record, Basing House. at: http://archaeologydataservice.ac.uk/archsearch/record.jsf?titleId=1033242; 27 Feb. 2013.
English Heritage. (2007a). Pastscape, Basing House at: http://www.pastscape.org.uk/hob.aspx?hob_id=240444; 01 May 2013.
Wikipedia. (2013). Wenesclaus Hollar – The Siege of Basing House at: http://en.wikipedia.org/wiki/File:Wenceslaus_Hollar_-_The_Siege_of_Basing_House.jpg; 6 Mar 2013.
Wikipedia. (2013). Launceston Castle at: http://en.wikipedia.org/wiki/File:Launceston_Castle_-_geograph.org.uk_-_22242.jpg; 12 Jul 13
Filed under: Spring Survey, Student Research Post, Will Heard Tagged: building survey, gpr, gps, ground penetrating radar, leica, magnetic susceptibility, magnetometry, new house, old house, resistance survey, resistivity, survey, surveying, topographic, total station, undergraduate

