Supply chains are more and more influx. International expanse of our supply chains makes us vulnerable to many risks. In this series of posts, we explore the global supply chains using international trade date. The trade data is available at UN Comtrade website. Comtrade collects the customs data of the world. Each country records its imports and exports records at the HS code levels of commodities. You can look up commodity codes, duty and VAT rates at UK Gov Trade Tariff.
Category: Uncategorised
Mirror Trade Data
We usually think of the trade of a commodity from an origin to a destination at a point of time as a singular value. However, there are two values pertaining to this notion. At one end, the country of origin registers the export of the commodity towards the destination (export value). At the other end, the country of destination registers the import of the commodity from the source (import value). These values together constitute the “mirror trade data”.
The fact is that the import and export values of a commodity between two countries at any point of time hardly every match. So, the “mirror” is distorted–looking more like a funhouse mirror!
The reasons for mismatch of the mirror trade data values are diverse, but among other reasons, one can imagine that what is exported from a country of origin at time t, will not be arriving to the destination country at the exact same time, and the distance between the partners of trade exacerbate this.
In this project, we especially explore this feature of mirror trade data to draw insights on the trade lead-time, i.e., how long it takes for the commodities to arrive from origin to destination.

Spot Light: Australian Meat to the UK
We look at some commodities that are exported from Australia to the UK.
Beef (HS 0204): Mirror trade data for this commodity is shown in the figure below.
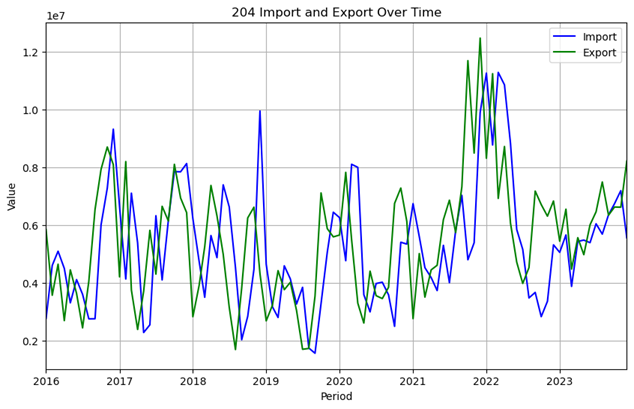
We can analyse the lead times and graph them as below:
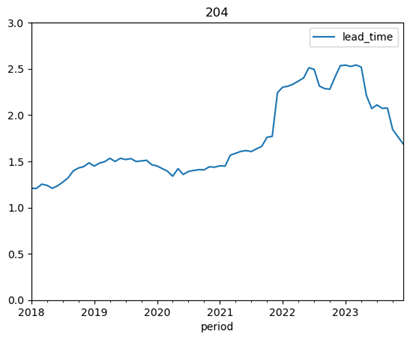
We see a spike in lead time towards the end of 2021 which continues until the beginning of 2023.
Modes of transport
Mirror trade data shows different average lead times for different commodities, indicating that various modes of transport are used in the logistics of different commodities, even across the same pair of trade partners. For example, below we depict some commodities traded between India and the UK.
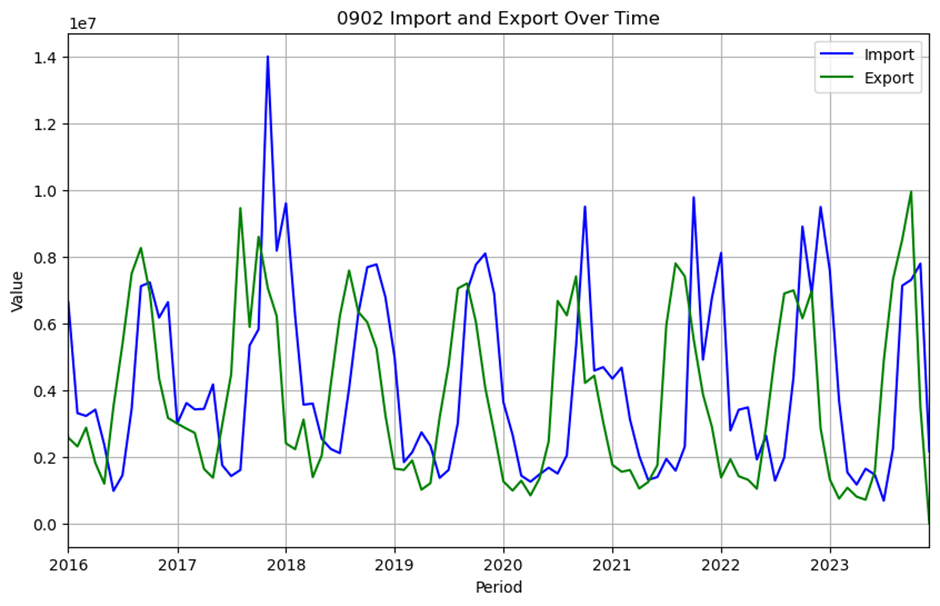
Figure below pertains to the mirror data on HS 0902 (tea).
The estimated lead time for this commodity over time is as follows:
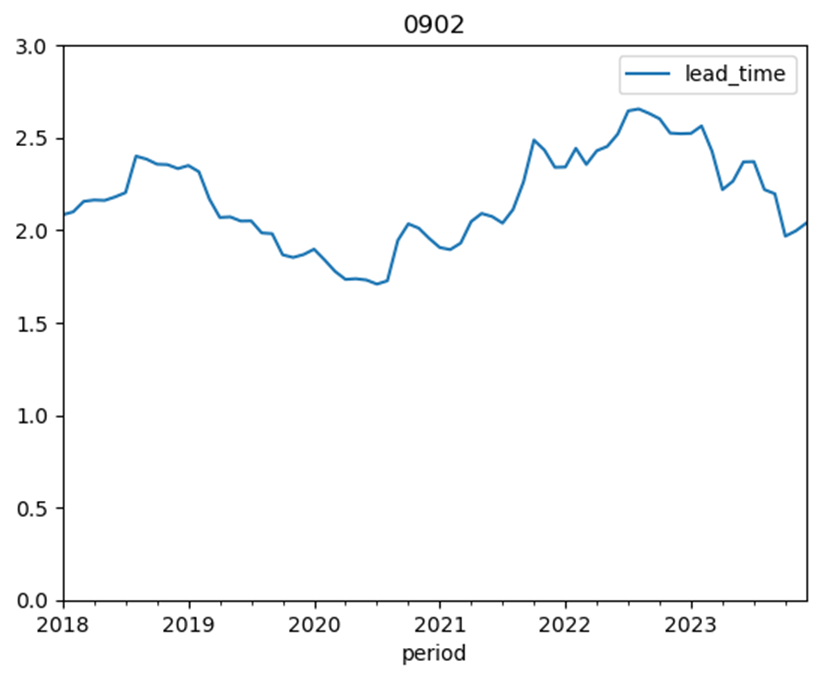
The average lead time for this commodity is about 2 months.
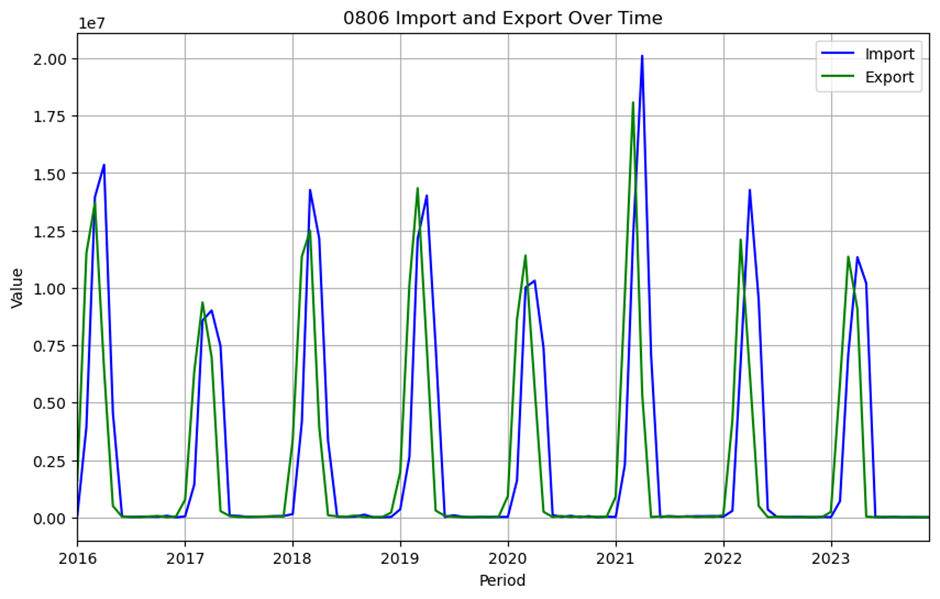
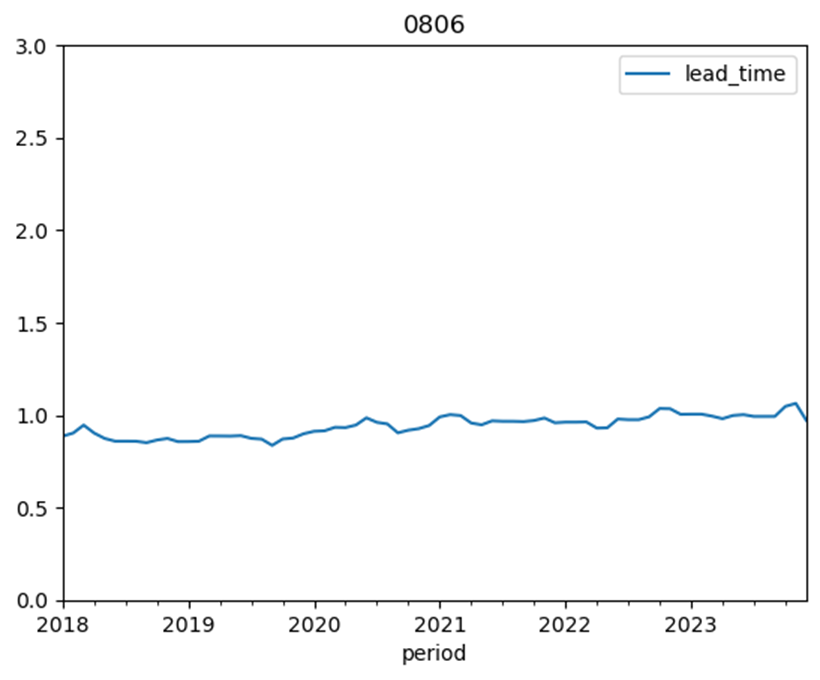
For the same pair of trade partners (India-UK), the mirror data on another commodity, HS 0806 (tea), shows an average lead time of 1 month.
The lead time estimate is as follows:
Detecting Air Freight
In international trade, there are many ways to move goods, and different transportation modes result in different “average” lead times. Across long distances, the main options are maritime or air transport.
Analysis of mirror data gives us clues on how things are moved in international trade. Air freight is extremely fast, resulting in almost instantaneous arrival of exports. This would be suited for commodities which are either very valuable or very perishable. Here are two examples:
HS 7108 (Gold): The following graphs shows the mirror data on exports of gold from Australia to the UK and EU combined:
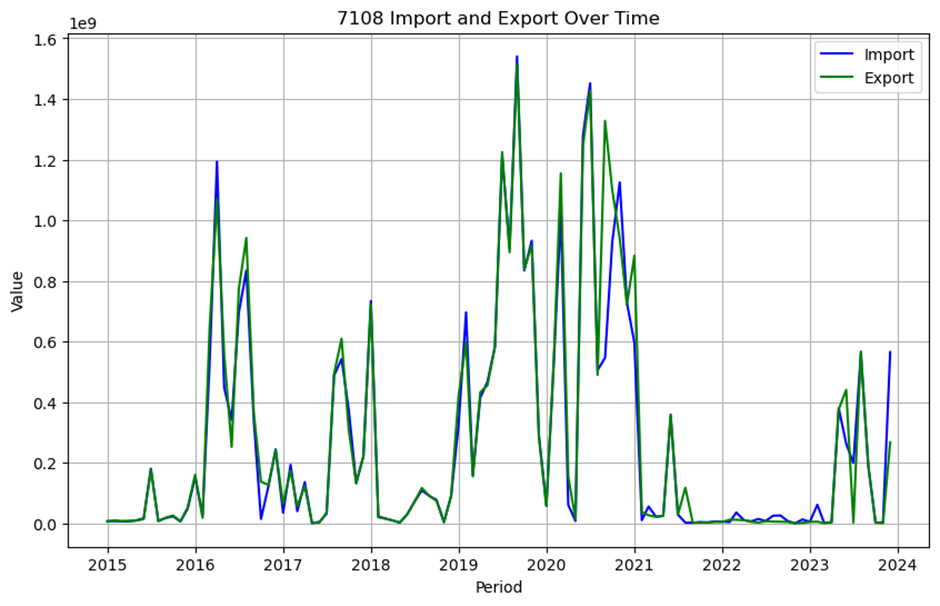
We can estimate the lead time as follows:
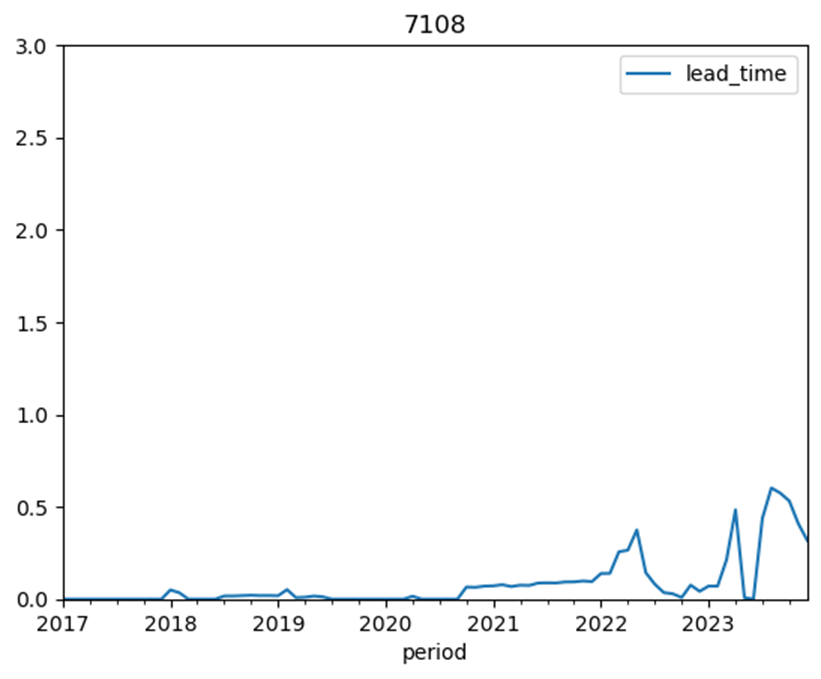
The lead time is almost zero, before 2022-2023 where it seems that goods are kept in the pipeline for a couple of weeks. Note that this can be during international leg of transportation or customs at the destination country.
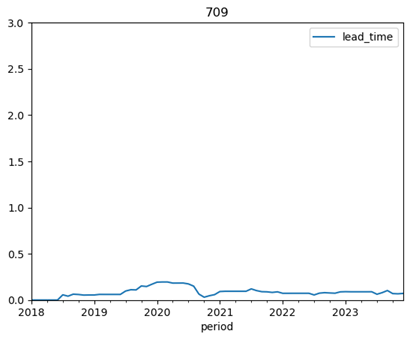
Another example is HS 0709 (fresh vegetables, e.g., asparagus, celery, etc.). Looking at the mirror trade data from Australia to the UK shows the situation:
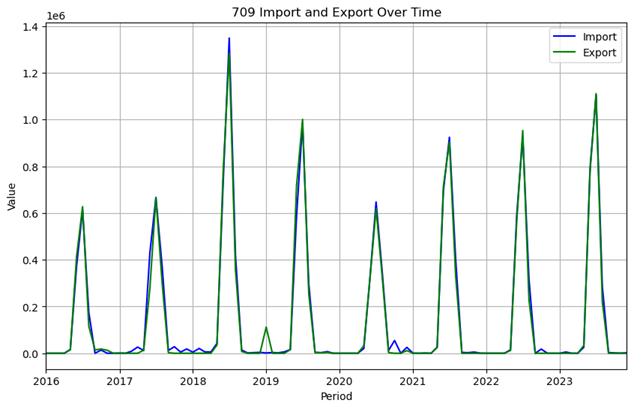
The match between the mirror data explains how our lead time estimates reveal air freight for these commodities:
“Orphan Imports” and “Missing Exports”
Mirror trade data contains major discrepancies associated with imports that have no apparent exports (orphan imports), or exports with no corresponding imports (missing imports).
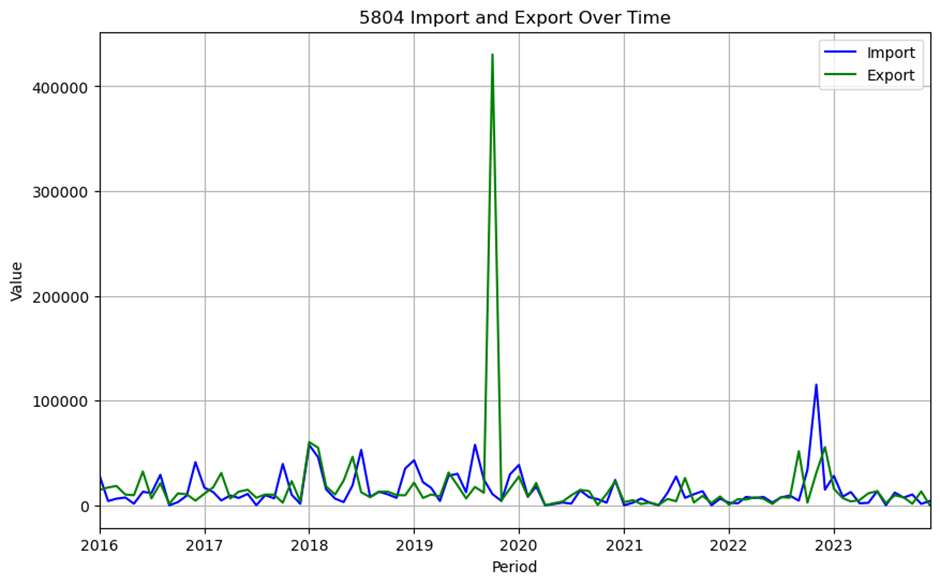
For example, consider the mirror data on HS 5804 (tulles and other net fabrics) from India to the UK. Toward the end of 2019, there is a major export volume without any imports values corresponding to it. This is a case of missing exports.
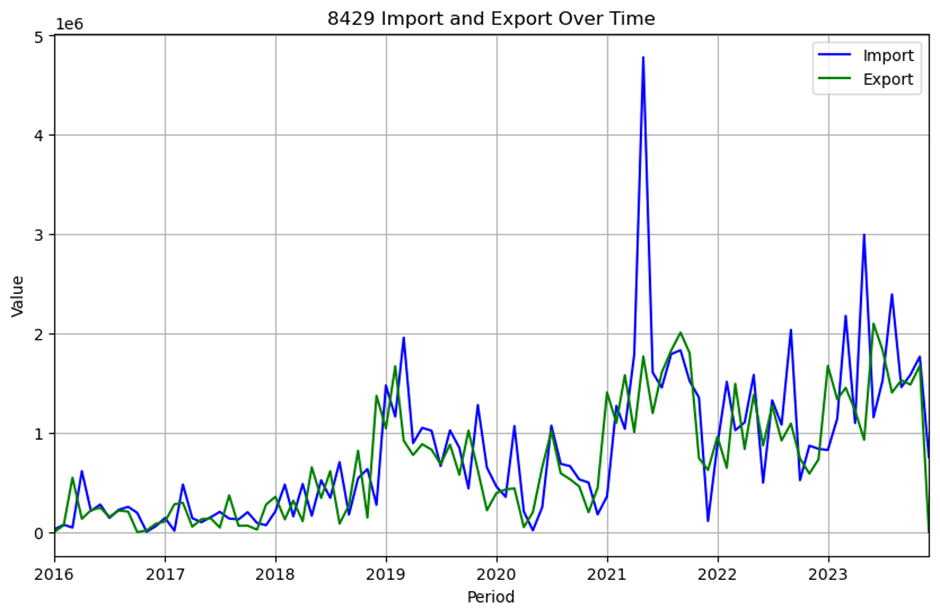
On the other hand, consider the the mirror data on HS 8429 (self-propelled bulldozers) from India to the UK. In 2021, we see a major import which does not have a corresponding export prior to that. This is an example of orphan imports.
The reasons for such “anomalies” are diverse. Sometimes, it is because of re-routing of the exports, that is, initially, an exporting country first announces a destination which later on changes. Note that the reported destination at the time of export is not binding. This also results in imports to countries without a corresponding reported export from the original country. However, this not the only issue. If we compare the exports of a country to all other countries in the world, we may still not get a balanced and still see anomalies.
This take us to the second reason for the mismatch. That is, differences in categorization of commodities. That is, Australia may categorize a commodity differently when exporting than what UK may recognizes as the correct commodity code of the same item.
There are also other reasons, for example, fraud, etc.
Indirect Imports and the Importance of Aggregation
Ideally, mirror trade data would gives us the content of trade between two countries lagged by lead time. Unfortunately, this is more like an exception that the norm. When an export towards a destination is reported, the destination is tentative, so the export may end of in another place. Later on, when the goods of a country of origin arrives at the destination, they would be recorded as imports from the origin and this is a more reliable measure of where goods have come from.
In light of the above, we may have to include intermediate countries with whom we guess the trade has been conducted. Here is an example.
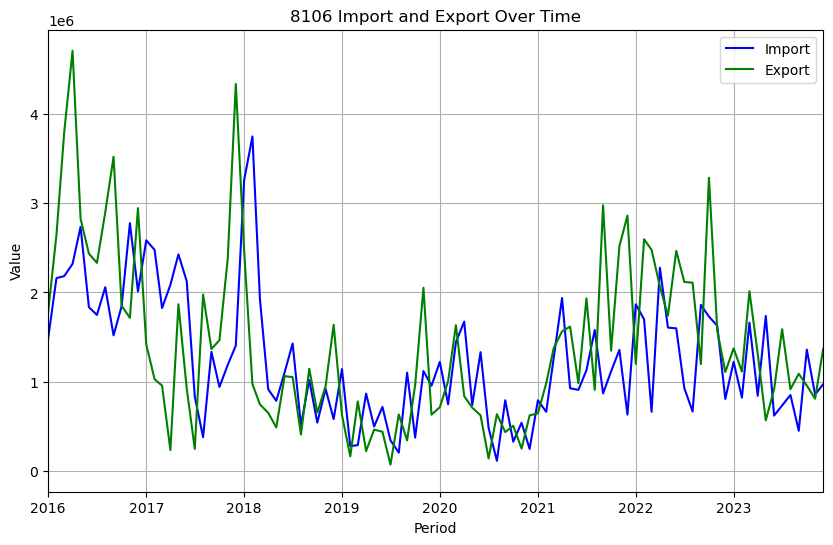
Consider the trade of HS 8016 (Bismuth and articles thereof). If we look at the exports from China to the UK, we get the following mirror data:
This is a bleak view since China has exported hardly anything to the UK while the latter has reported imports from the former. This is because what China had reported as exports to other countries have eventually ended up in the UK.
Aggregation is the key to this challenge. We now consider the mirror trade data between China and 17 of main EU countries plus UK. At this level of aggregation, we get much better match between the exports and imports, as can be seen in the figure below: