7.2 Environmental hazards
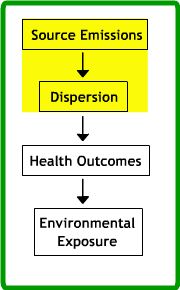
This learning object provides an overview of the different types of environmental hazard that exist. Some understanding of these hazards is necessary in order to apply GIS to environmental epidemiological problems. It is thus concerned with source emissions and their dispersion through the environment.
Types of environmental hazard
Environmental hazards include a broad range of substances, including chemicals (e.g. sulphur dioxide and ozone from car fumes), biological agents (e.g. pathogenic E. coli bacteria from faeces), radio-activity and even noise. These hazards can also be classified according to their sources. Point source pollutants include chimney stacks or outlet pipes from factories, whilst a busy road is a linear pollutant source. Diffuse (non-point source) pollution is not associated with any discrete geographical feature but is spread across the environment. For example, nitrogen fertiliser or pesticide may be applied to broad areas of agricultural land. This typology directly relates to how pollution sources are represented within a GIS, either as points, lines or continuous fields. A point source of pollution might be the chimney of an incinerator, whilst a stretch of motorway would form a line source of atmospheric pollutants such as nitrogen dioxide.
Different hazards can also be classified according to their effect on exposed individuals as estimated through toxicological studies. Threshold effects occur where the health impact of a pollutant increases markedly above a specified pollutant concentration, whilst non-threshold effects occur where health impacts increase more steadily in proportion to pollutant concentrations. Again, the two types of toxicant may be represented spatially in different ways. Non-threshold toxicants can be represented as a continuous field, whilst threshold toxicants would be best represented as a Boolean map.
Data sources for environmental hazards
In general, data concerning pollution sources are fairly accessible. In the US, data on industrial discharges are freely available and searchable by zip code through the Toxics Release Inventory, compiled by the US Environment Protection Agency. This database is compiled from compulsory reporting forms submitted by industrial sub-sectors, whose operations involve potentially toxic chemicals. The locations of plants that handle such chemicals, as well as details of any toxic releases are recorded. In the UK , a similar database exists but is available to the public only on a commercial basis as the Environment Agency Property Search facility.
In some instances, pollution levels are monitored not at source but throughout the environment at downstream locations. For example, the Scottish Environmental Protection Agency (SEPA) runs a network of some 3,000 water quality monitoring sites across Scotland , where ammonia, dissolved oxygen and toxic substance concentrations are monitored. Although such ambient monitoring systems provide useful data, they often specifically target certain sites. For example, the SEPA water quality monitoring network currently targets water bodies of ecological importance and typically has twin monitoring stations upstream and downstream of potential pollution sources such as discharge pipes. Interpolating surfaces of pollutant surfaces from such data can therefore be problematic.
In a few smaller scale studies, experiments have been made at monitoring environmental risks in a way that is more closely linked to the population at risk. Micro-environmental monitoring entails detailed, localised monitoring of pollutant levels. Such monitoring might place measurement equipment in the playground and different buildings within a school, for example. In contrast, personal monitoring systems attach portable measurement devices to individuals at risk. As these individuals go about their daily activities, pollutant concentrations are monitored at the point of exposure.
These data sources are often cross-checked against one another, rather than being used in isolation. For example, micro-environmental monitoring results can be used to cross-check the accuracy of an interpolation from ambient pollution monitoring data.
Activity
EITHER (a) read the references below OR (b) identify and read an article of your choosing that uses GIS to assess the health effects of an environmental pollutant of your choosing.
Use the article(s) you have read to answer the following questions:
- Whether there is a level of exposure that is considered safe for human health (for example, less than 1 E. coli bacterium / 100 ml of drinking water is considered safe for human consumption by WHO).
- Whether or not the environmental hazard occurs naturally (e.g. E. coli can be found in the faeces of wild animals, so there is some natural occurrence of this organism)
- Briefly describe the data source used to study exposure to your chosen hazard and how the environmental hazard is represented in a GIS (e.g. Water utility companies may have E. coli counts for routine samples of drinking water. These may be attached to sample point locations on a map).
Post your answer up to the course discussion forum.
References (Essential reading for this learning object indicated by *)
The following two references may be used for the assignment:
Jacques, G. M., and Greiling, D. A. (2003) Geographic boundaries in breast, lung and colorectal cancers in relation to exposure to air toxics in Long Island, New York. International Journal of Health Geographics 2, 4. http://www.ij-healthgeographics.com/content/2/1/4
Miller, K. A., Siscovick, D. S., Sheppard, L., et. al. (2007) Long-term exposure to air pollution and incidence of cardiovascular events in women. New England Journal of Medicine 356, 447-458. https://doi.org/10.1056/NEJMoa054409
The Toxics Release Inventory (TRI), compiled by the U.S. Environmental Protection Agency, is available here: http://www.epa.gov/tri/
Equivalent databases in the UK can be found for point sources via the UK Pollutant Release and Transfer Register (PRTR) compiled by the Department for Environment Food and Rural Affairs (DEFRA): https://www.gov.uk/guidance/uk-pollutant-release-and-transfer-register-prtr-data-sets#pollutants-and-thresholds-list or for diffuse sources via the National Atmospheric Emissions Inventory (NAEI): https://naei.beis.gov.uk/.