4.1 Point mapping
Many health data sets are represented spatially as points. For example, the locations of individuals suffering from a disease may be geo-coded using residential address to produce a point data set. Maps based on point data sets can be a useful means of communicating patterns of disease risk to policy-makers. This object describes the principles and potential pitfalls in producing such maps.
The production of a point map of cases can be a useful quality control check and a preliminary means of exploring patterns. Plotting out a map of cases often brings to light data quality issues. If any cases appear in areas of sea, for example, there are clearly problems with the geo-referencing process! One obvious problem in viewing a point map of cases is that apparent clusters may simply reflect variation in population density and not underlying variation in disease risk. An apparent cluster of cases may occur in an inner city neighbourhood, for example, simply because more people live there. To overcome this problem, one way forward is to plot the locations of both disease cases and similar healthy individuals (known as controls) using different point symbols or colours. Spatial patterns in disease cases can then be visually compared with any spatial patterns among healthy individuals, so producing a visual method of identifying areas of high disease risk.
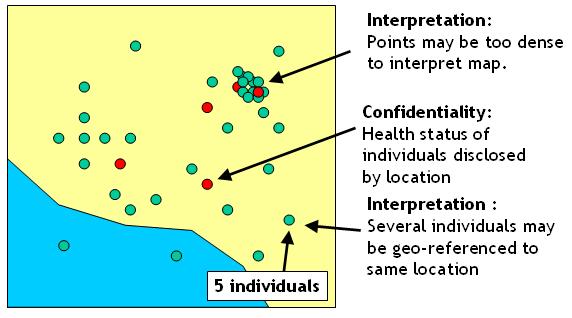
There are several difficulties in mapping health data as points without any further processing. Sometimes, there may be multiple disease cases at the same location on the map and this will not be apparent from examining a point map. For example, in a developing country, cases may be geo-coded to points representing local villages and several cases may occur within the same village. To some extent, this problem can be overcome by increasing the size of a point symbol where more cases have been recorded. In large data sets, the density of points may be so great that a reader may be unable to discern spatial patterns properly. Finally, most health data are subject to confidentiality restrictions and producing a point map is likely to breach these confidentiality requirements. Where the density of points or confidentiality issues restrict the use of dot maps, alternative options are available to the cartographer, such as mapping disease rates within areas.
Activity
Download this zip file, which contains a point data set of liver disease, and complete the activity described in the accompanying instructions (which are available in ArcGIS Pro and Desktop formats).
References (Essential reading for this learning object indicated by *)
A good example of dot maps being used to support an epidemiological investigation is described in this article:
Eng, S. B., Werker, D. H., King, A. S., Marion, S. A., Bell, A., Issac-Renton, J. L., Irwin, G. S., Bowie, W. R. (1999) Computer-generated dot maps as an epidemiologic tool: Investigating an outbreak of toxoplasmosis. Emerging Infectious Diseases 5, 815-819 http://www.ncbi.nlm.nih.gov/pmc/articles/PMC2640797/