3.6 Environmental factors data
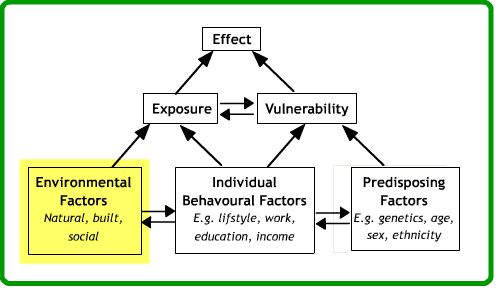
Many diseases are related to the environment in which people live and many health GIS applications study these relationships. In a health context, environmental factors not only encompass the natural environment (climate, soils, etc.), but also the built environment such as the type of housing in which people live, and the economic and social characteristics of their neighbourhood. Each of these types of environmental factor and the relevant spatial data sources is considered in turn below.
The built and economic environment:
The built environment comprises buildings, roads, parks and facilities that form part of human settlements. In some instances, health complaints may be related to specific aspects of the built environment. For example, the symptoms of lead poisoning can be specifically associated with older housing where lead water pipes may still exist. More commonly, patterns of ill health may be related not to any single characteristic of the built environment but to living in an area which is deprived in terms of multiple characteristics. Many mental health problems, for example, are related to living in deprived areas but not specifically to any one aspect of the built environment.
Material deprivation is a ‘lack of goods and services, resources and amenities and of a physical environment that are customary in society
Townsend, 1987
In such circumstances, composite measures of multiple deprivation are often used to measure the health risks from the environment. Examples of such composite measures in the UK include the Townsend measure of material deprivation (see illustration below) and the Jarman Underprivileged Area Score. As well as including measures of the built environment, both these indices also measure the economic environment either in terms of employment opportunities or car and home ownership within a neighbourhood.
Many measures of the built and economic environment rely on census data, which are collected only once every decade and run the risk of being out of date. Consequently, measures have recently been developed that are based on data collected every month. For example, in the UK, the company Experian have developed measures of car ownership and housing for different post codes based on property transactions and records from the government Driver and Vehicle Licensing Agency.
An alternative approach to assess the effect of the built environment on health is by examining proximity to facilities or to hazards. For example, a study in the USA looked at the relationship between patterns of obesity in children and proximity to fast-food restaurants. The study also explored the effect of provision of parks and recreational areas on obesity patterns. Similarly, numerous studies have explored patterns of cancer in relation to proximity to potential pollution sources, such as nuclear power stations, incinerators, and waste dumps.
The natural environment:
GIS studies examining the relationship between the natural environment and health have largely concentrated on three areas: the environmental distribution of pollutants, the effect of climate, and the ecological ranges of vectors known to cause disease such as mosquitoes. Biometeorology explores the linkages between health and climate. One of the main areas of current research is in identifying the effect of climate change on disease rates.
A second area of research is mapping the spatial distribution of intermediate hosts for infectious diseases. GIS studies have assessed the environmental distribution of water snails that spread schistosomiasis, Anopheles mosquitoes responsible for malaria, and ticks responsible for lyme’s disease.
A third area for GIS studies of the natural environment is identifying the distribution of pollutants in the environment. For example, radon gas may leak from granitic rocks, increase exposure to radio-activity, and so increase risk of cancer. The distribution of radon gas may be assessed by interpolating between measurements at radon monitoring sites.
The social environment :
Individuals are affected not only by the physical characteristics of their environment, but by the presence of social support networks and the behaviour of their neighbours. For example, in an environment where many adolescents smoke, peer pressure on other adolescents to smoke will be greater. Much the same social factors affect patterns of drug use and sexual behaviour. The social environment tends to be difficult to quantify in GIS studies and is thus often not included in spatial analyses of disease causality.
Activity : Measuring environmental factors in practice – GIS and malnutrition
One of the most basic environmental risks to human health is a lack of access to food. Aside from the direct effects of starvation, poor nutritional status increases vulnerability to other diseases, such as dysentery and cholera. GIS has an important role to play in forecasting the timing of famines and ensuring adequate and timely food aid provision. Consequently, many of the major international aid agencies have invested in GIS.
View the World Food Programme and U.S. Agency for International Development web sites below. Next:
- Choose one country (e.g. Zimbabwe).
- Draw up a list of the data that you might use to measure food access in different regions of your chosen country.
- Now draw up a list of the spatial factors used to measure food security (access to food) by the aid agencies in your chosen country. How do the factors chosen by the aid agencies compare to your own list?
- On your list, note what you consider to be environmental factors data on each web site (rather than behavioural or predisposing)?
- On your list, note which aspect of the environment each factor is measuring (social, built, economic or natural)
- On your list, also note the data source(s) that the agency uses
An example of the early part of such a list is provided below.
What do you notice about the types of measure and data sources used by the aid agencies? Do you foresee any data quality problems affecting the measures used? What’s the relative balance of measures of social, economic, natural and built environment? Post your list and any observations you make about it to the course web site.
Table 1. COUNTRY: Zimbabwe
| FACTOR | Type of factor | Type of environmental factor (if appropriate) |
Data source |
|---|---|---|---|
| Grain Price | Environmental / |
Market surveys | |
| Rainfall | Environmental / |
Meteorological and satellite data | |
| Etc. | Environmental / behavioural / pre-disposing | Built / Economic / natural / social |
References (Essential reading for this learning object indicated by *)
* The United Nations World Food Programme runs a Global Information and Early Warning System:
http://www.fao.org/giews/countrybrief/
Links to data on satellite imagery, food prices and rainfall estimates are available via links on the left-hand side of this page.
* The US Agency for International Development (USAID) runs a similar Famine Early Warning System (FEWS): http://www.fews.net/
* Much of the USAID data is available through the Africa Data Portal:
http://fews.net/data
Examples of environmental factors data from the developed world include deprivation measures, such as the Scottish index of multiple deprivation: https://www.gov.scot/collections/scottish-index-of-multiple-deprivation-2020/
Townsend, P. (1987) Deprivation. Journal of Social Policy 16, 125-146.