3.4 Predisposing factors data
Predisposing factors are those that describe the principal personal and demographic characteristics of a study population. They are personal characteristics which are not determined by the behavioural choices of the individual, but which have a major impact on their health experience.
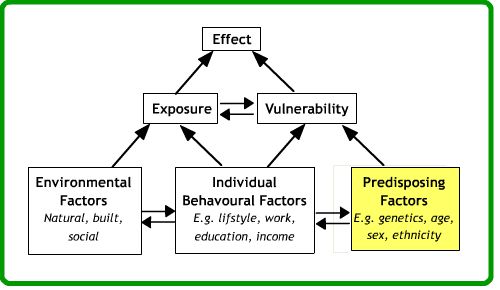
Predisposing factors include variables such as age, sex and ethnicity. There are two principal routes by which we may obtain data about predisposing factors. Denominator information of this type is most commonly obtained from population censuses and administrative sources such as population registers: these are published as aggregated records for geographical areas. This information may be also be collected in relation to individuals through specific health surveys or medical records systems. Administrative sources such as population registers and records maintained by the health care system do not usually contain as much attribute detail as censuses or data sets that have been directly collected as part of a clinical research project.
Statistical population registers are currently only maintained in a small number of countries, particularly in Scandinavia. The outputs from such monitoring systems are generally published in a similar form to that from population censuses (Van der Lann, 2001).
Where population information is very sparse, community health surveys and other specific health data collection exercises may also be aggregated to produce census-like information. Aggregated census-type data is most widely available and more commonly used in health GIS although great care is required with their use. When data about predisposing factors are collected as part of a clinical study or health survey, we are able to associate the predisposing factors of each individual directly with their health outcomes. When the data have been aggregated within a national population information system we have no way of doing this and any associations which we observe must therefore be interpreted carefully in the light of the ecological fallacy and modifiable areal unit problems. We shall here consider the key issues in an international context, with particular use of examples from the UK, USA and South Africa. A wide range of online resources exist for exploring the availability of such data in other countries.
Topics and definitions
The questions asked and definitions adopted within a general-purpose population data collection exercise such as a census are not necessarily those that would be chosen by the researcher. Moss (1999) reviewed this aspect of preparation for the 2001 census of England and Wales, explaining the complex process of user consultation, questionnaire design and testing that lead up to the inclusion of specific topics. In particular, age and ethnicity offer many different options for the definition of categories – both in questionnaire design and data publication. Once aggregated to age groups such as ‘aged 15-24’ or ethnic groups such as ‘Black Caribbean’ it is not possible to subdivide these groups differently for analysis. A range of census questionnaires may be viewed on the web sites of national statistical organisations.
Coverage
Censuses are attempts at complete enumeration of a population, but internationally response rates to conventional censuses have been falling through time and alternative strategies including rolling population surveys have been widely considered (see the collection of papers in UNFPA, 2003). Adjusting for underenumeration in censuses is a growing feature of census analysis. It is important to understand how the overall underenumeration affecting key demographic data will impact on the basic data about predisposing factors. For example, census underenumeration is usually biased towards particular population sub-groups. Young men and specific minority ethnic groups are typically those who may distrust official procedures and either seek to avoid enumeration, or be hard to reach using conventional enumeration methodologies. The underrepresentation of these groups in published area-based population data will clearly have adverse effects on GIS analysis which uses these information sources as reference layers. Particularly when related to health event data from different data sources, the apparent rates for these sub-groups (which are often the groups of most interest to health analysts) may be significantly affected. Where data about predisposing factors is based on sample surveys or on sample encoding of census responses then a further consideration is that of sampling error. This factor should always be taken into account when mapping predisposing factors in relation to health event data: the same principles will apply as for the handling of any other sample survey data.
Timelines
There is international variation in the frequency of census-taking, but most commonly 5- and 10-yearly cycles are followed, with a major census ’round’ occurring at the start of each decade in the years ending -00 and -01. The two most recent censuses in the UK were in 2011 and 2021, but in Australia were in 2016 and 2021. Some countries such as France are no longer holding conventional full censuses at all, adopting instead a ‘rolling census’ which will allow basic demographic information to be updated more frequently. The USA adopted a combination of short form census in 2010 with a rolling American Community Survey – again designed to achieve more timely information. The main trend looking towards the 2020/21 round of censuses was a shift towards online enumeration models (‘online first’ or ‘eCensuses’). It is important to recognise that population characteristics may change significantly in small areas. This particularly affects areas of rapid residential development, where many thousands of people may be resident in locations which were unpopulated at the time of the most recent census. An important task in working with health GIS is to ensure that the denominator information is available for appropriate time periods in relation to the health event data being studied: health event data will usually relate to much more specific dates, and may require aggregation over time in order to achieve comparability with predisposing factor data for the denominator population. Official population estimates may be of some help, although these are not usually available for small geographical areas and only the key demographic indicators are estimated rather than values for the predisposing factors of most interest here.
Geographical units
One of the most basic aspects of establishing a GIS application for analysis of health is the choice of geographical units for which predisposing factors data are available. These most commonly reflect the hierarchical administrative division of a country, although the precise scheme adopted can be complex. When working with health GIS we will generally wish to obtain data about predisposing factors at the highest possible levels of geographical resolution. Census results are almost always confidential at the level of the individual and may not be assigned individual addresses or geographical codes at this scale. The lowest level of geographical aggregation which is theoretically possible is therefore usually directly related to the organisation of census enumeration, with the geographical area covered by one enumerator frequently the smallest spatial unit to be assigned an unique code. For the 2001 Census in England and Wales 175,000 output areas were created with a mean of 125 households in each and these remained largely unchanged in 2011 and 2021. In other countries, the lowest level geographical units may be very much larger. A further important aspect of the geographical units is the extent to which their relationship with other geographical referencing systems is known. Where the relationship between census and other important geographies is not hierarchical, lookup tables may also be available which describe how data should be aggregated (or interpolated) to produce counts for areas which do not fall neatly into the census output geography.
Data format and availability
Many national statistical organisations now offer the ability to interrogate census results and even produce thematic maps online. These can be powerful tools for initial exploratory analysis, but do not usually offer any analytical facilities or extended GIS functionality. The user of a health analysis GIS is therefore required to obtain digital boundary files and attribute data and load these into local GIS software.
Arrangements for the dissemination of such data vary widely. The ability to download limited quantities of information from the national statistical organisation’s web site is widespread, but this rarely extends to complete coverage of the most detailed census questions or smallest geographical units. Bulk supply of boundaries and attributes is usually required for extensive GIS use. In the UK and South Africa, digital boundary data may be obtained directly from the national statistical organisations and are generally also available through online portals. In some cases, intermediary organisations have taken delivery of census attributes and boundaries and re-supply these to GIS users, either commercially or as part of a bulk supply arrangement for a specific user sector, such as the UK Data Service. Intermediaries generally undertake much of the work in reformatting bulk data supply from statistical organisations and deliver integrated attribute and boundary data in a variety of GIS formats.
Activity
Read the web resources and references suggested and take particular note of the ways in which the issues covered here will affect the quality and interpretation of these data sources for the purpose of defining predisposing population characteristics in a health GIS. There are very many more resources available on the web in relation to specific countries – check what documentation is available for your own national statistical organisation or that of another country with which you are familiar. Many of these are listed at http://census.ukdataservice.ac.uk/get-data/explore-online. Keep a note of your observations on this activity for your own record, so you can refer to them when you need to work with data of this type.
References (Essential reading for this learning object indicated by *)
Moss, C. (1999) Selection of topics and questions for the 2001 Census. Population Trends 97, 28-36 http://www.ons.gov.uk/ons/rel/population-trends-rd/population-trends/no–97–autumn-1999/a-selection-of-topics-and-questions-for-the-2001-census.pdf
South African 2022 Census data: https://census.statssa.gov.za/#/
South Africa 2011 Census questionnaires: http://www.statssa.gov.za/?page_id=3852
England 2021 Census question and questionnaire development: https://www.ons.gov.uk/census/censustransformationprogramme/questiondevelopment/questionandquestionnairedevelopmentoverviewforcensus2021
*Office for National Statistics Census 2021 (England and Wales) overview: https://www.ons.gov.uk/census
Office for National Statistics Open Geography Portal http://geoportal.statistics.gov.uk/
USA 2020 plans for census questions: https://www2.census.gov/library/publications/decennial/2020/operations/planned-questions-2020-acs.pdf
Van der Lann, P. (2001) The 2001 census in the Netherlands integration: of registers and surveys Paper presented at the INSEE-Eurostat Seminar on censuses after 2001 http://www.insee.fr/en/insee-statistique-publique/connaitre/colloques/insee-eurostat/pdf/laan.pdf
*UNFPA (2003) Counting the people: constraining census costs and assessing alternative approaches Population and Development Strategies Series 7 Available at https://www.unfpa.org/sites/default/files/pub-pdf/counting_people.pdf
US Bureau of the Census 2020 resources: https://www.census.gov/programs-surveys/decennial-census/decade.2020.html#list-tab-693908974/
Access to UK census data: http://census.ukdataservice.ac.uk/about-us